Free Access
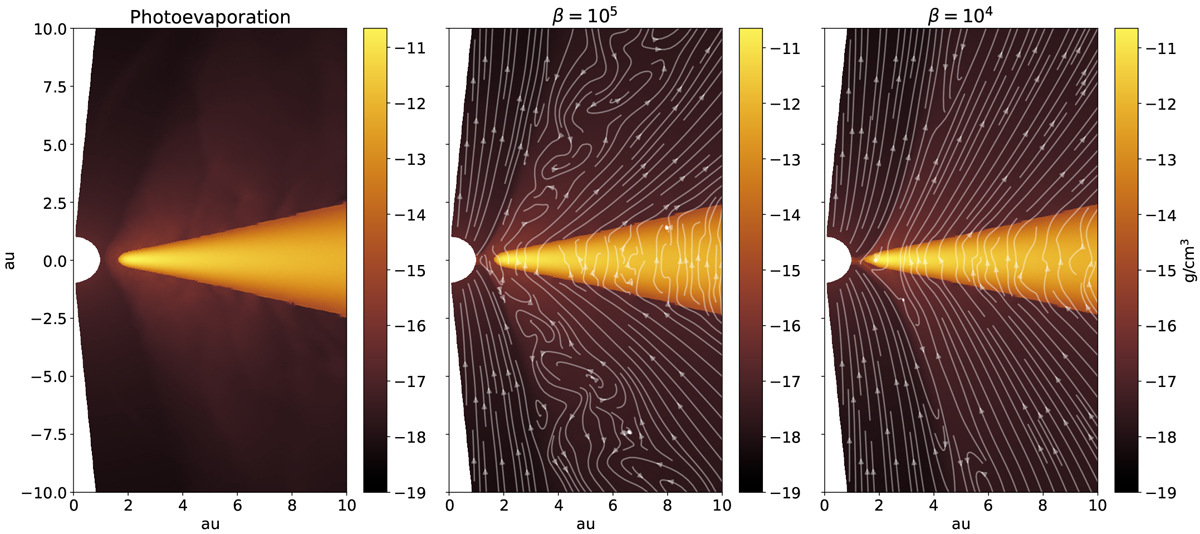
Fig. 1
Download original image
Gas density maps of the simulations phc2, b5c2 and b4c2 after 500 orbits at 1 au. Magnetic field lines are represented by the white lines in the corresponding panels. The color map scaled logarithmically annotated by the exponent to a base of ten and represents the volume density of the gas in g cm−3.
Current usage metrics show cumulative count of Article Views (full-text article views including HTML views, PDF and ePub downloads, according to the available data) and Abstracts Views on Vision4Press platform.
Data correspond to usage on the plateform after 2015. The current usage metrics is available 48-96 hours after online publication and is updated daily on week days.
Initial download of the metrics may take a while.