Free Access
Fig. 2.
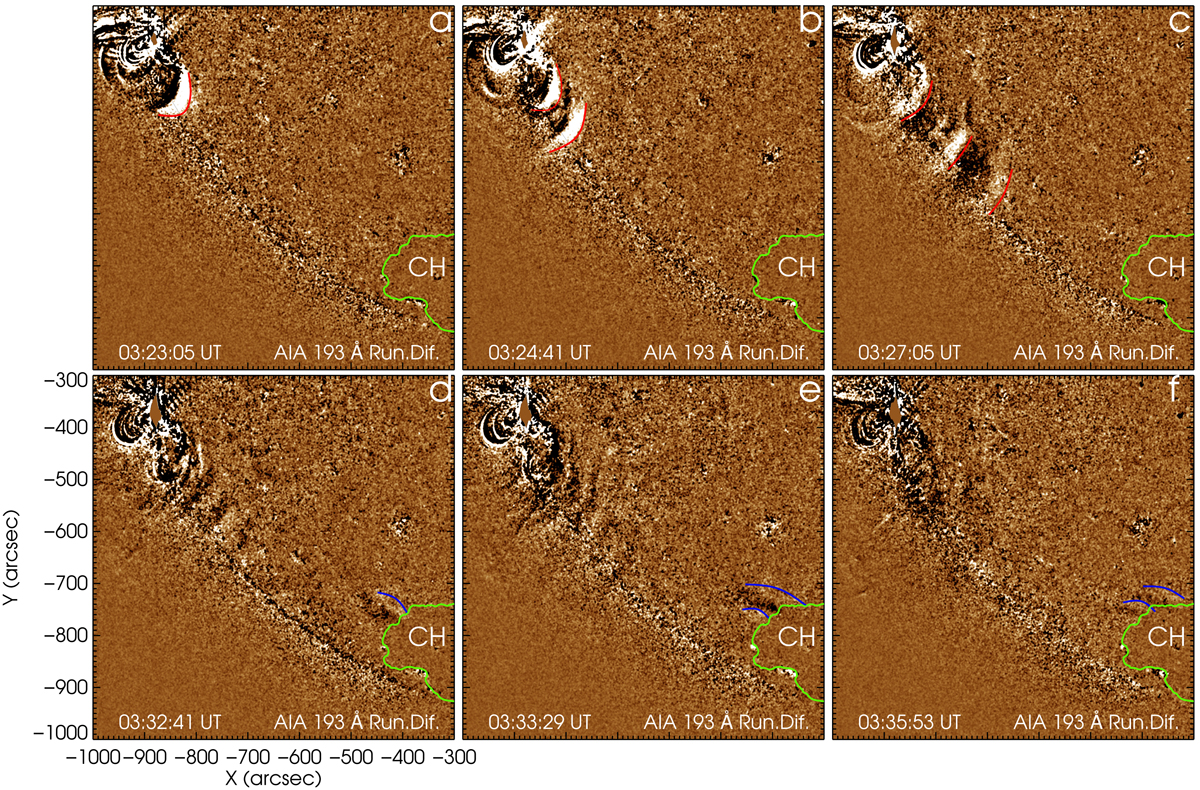
Download original image
Evolutions of the incident wave trains (top) and reflected wave trains (bottom) in 193 Å running-difference images. In each panel the red and blue lines depict the wavefronts of the incident and reflected EUV wave trains, respectively, while the green lines mark the location of the CH boundary.
Current usage metrics show cumulative count of Article Views (full-text article views including HTML views, PDF and ePub downloads, according to the available data) and Abstracts Views on Vision4Press platform.
Data correspond to usage on the plateform after 2015. The current usage metrics is available 48-96 hours after online publication and is updated daily on week days.
Initial download of the metrics may take a while.