Fig. 1.
Download original image
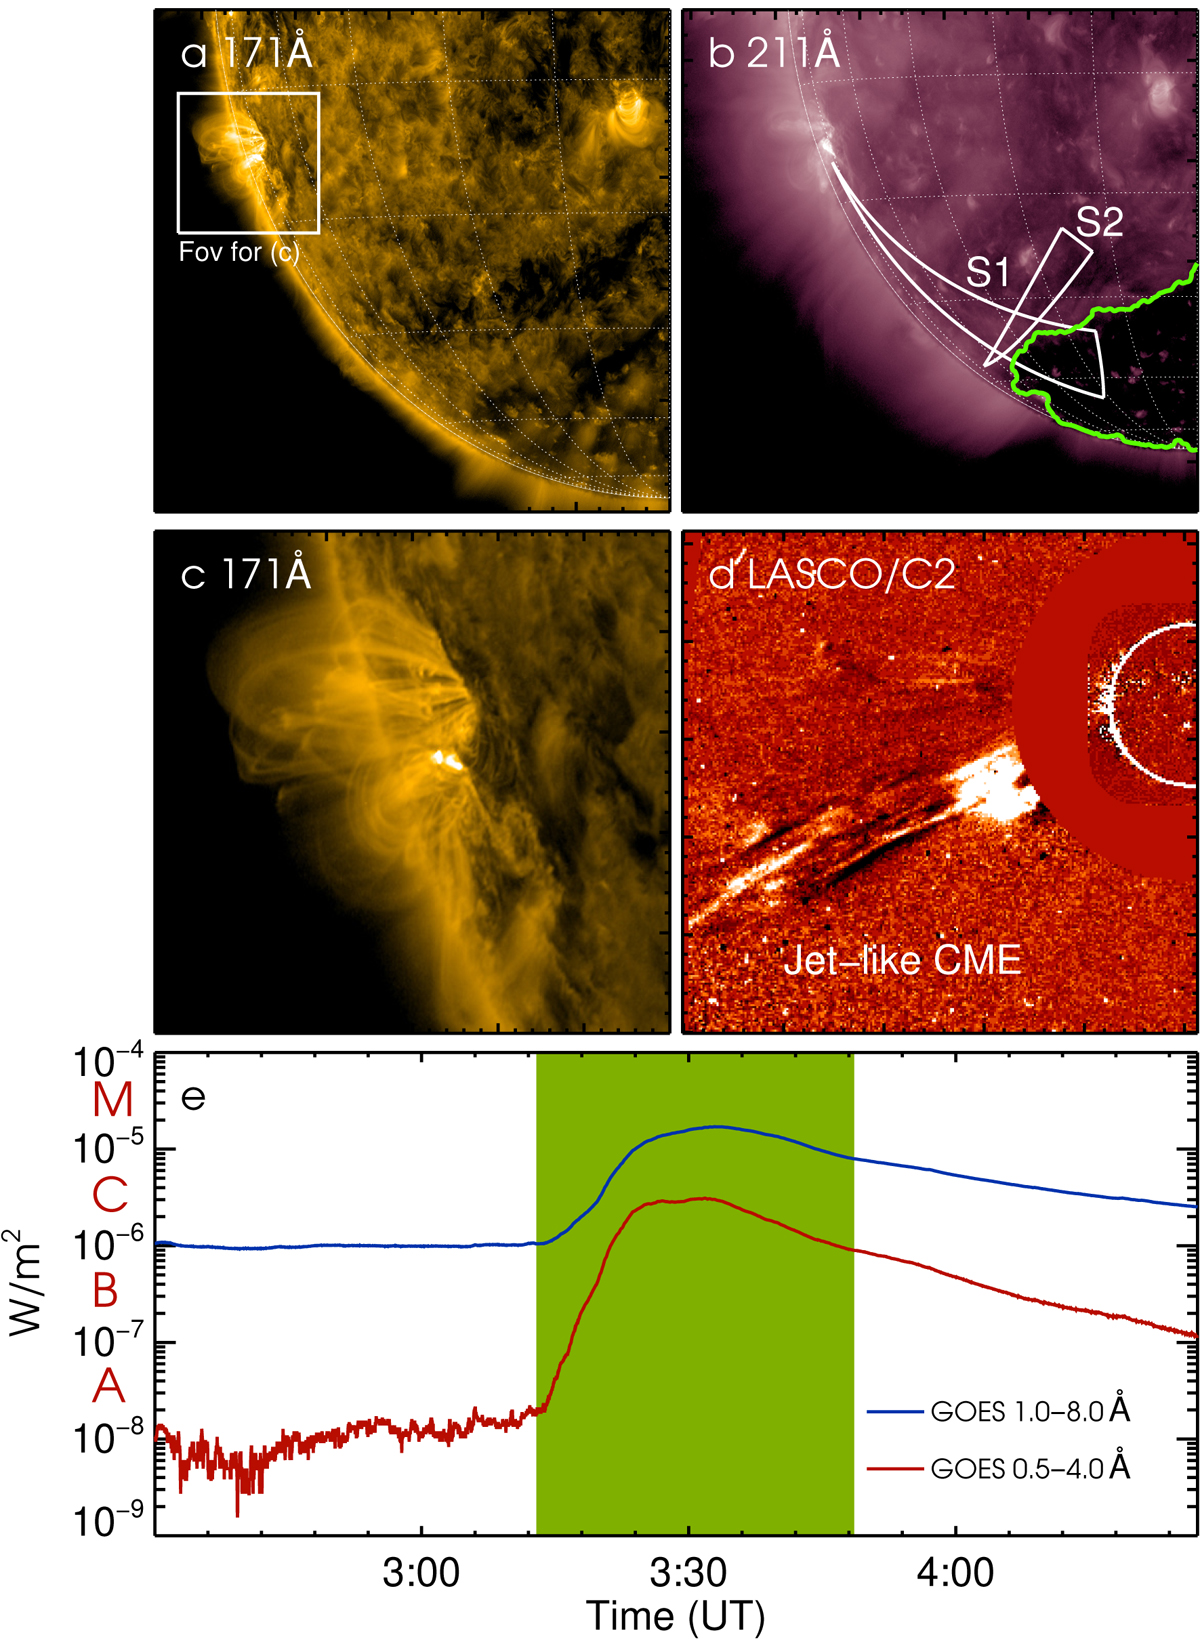
Overview of the event. Panels a, b, and d: are AIA 171 Å, AIA 211 Å and LASCO/C2 snapshots, respectively. The field of view of panel c is marked by the white box in panel a. The incident and reflected wave trains are tracked with the two sectors indicated as S1 and S2, and the green line marks the location of the CH boundary in panel b. Panel e: solar soft X-ray recorded by the GOES in 0.5−4.0 Å (red) and 1.0−8.0 Å (blue). The green region marks the start and end time of the flare in NOAA AR 12473.
Current usage metrics show cumulative count of Article Views (full-text article views including HTML views, PDF and ePub downloads, according to the available data) and Abstracts Views on Vision4Press platform.
Data correspond to usage on the plateform after 2015. The current usage metrics is available 48-96 hours after online publication and is updated daily on week days.
Initial download of the metrics may take a while.