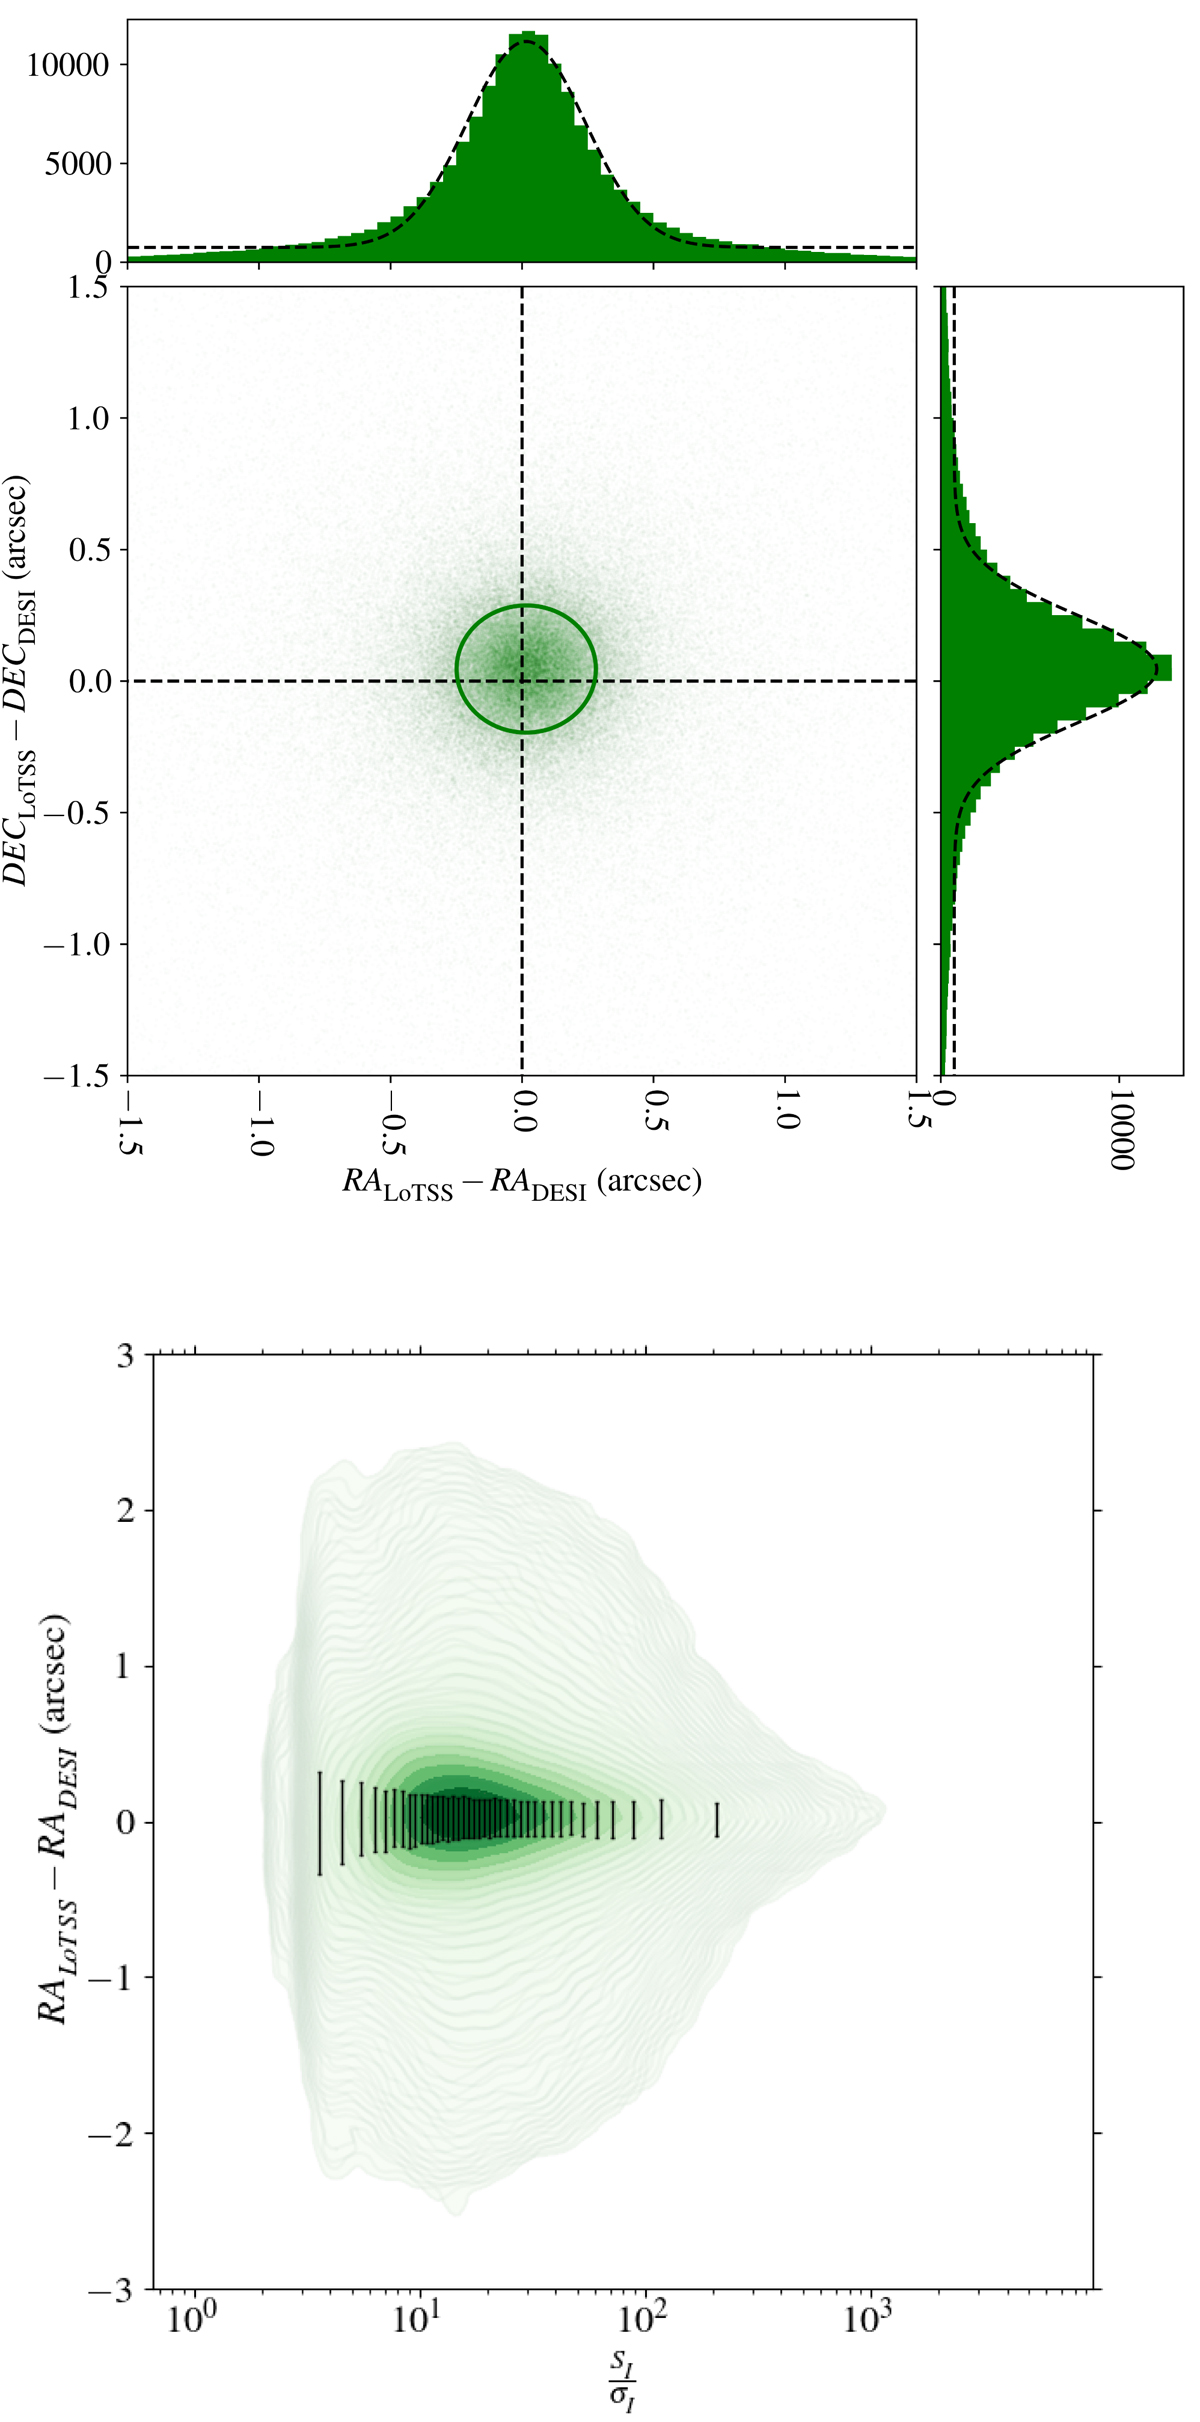
Fig. 8.
Download original image
Astrometric accuracy of the LoTSS-DR2 radio wavelength positions. The top plot shows the offsets in RA and Dec for compact, deconvolved LoTSS sources from their DESI Legacy Imaging Surveys counterpart. The histograms show the distribution of offsets as a function of RA and Dec and the fitted Gaussian (plus a constant) functions have σRA = 0.22″ and σDec = 0.20″ and are centred at offsets of 0.02″ in RA and 0.05″ in Dec. The constant in the fitted function is included to allow for possible mismatches in the association of LoTSS and DESI sources. The bottom plot shows the distribution of RA offsets as a function of signal to noise with the total length of the error bars corresponding to the standard deviation of the Gaussian (plus a constant) function fitted to the sources in that particular signal to noise bin. The signal to noise bins are selected such that they contain an equal number of sources.
Current usage metrics show cumulative count of Article Views (full-text article views including HTML views, PDF and ePub downloads, according to the available data) and Abstracts Views on Vision4Press platform.
Data correspond to usage on the plateform after 2015. The current usage metrics is available 48-96 hours after online publication and is updated daily on week days.
Initial download of the metrics may take a while.