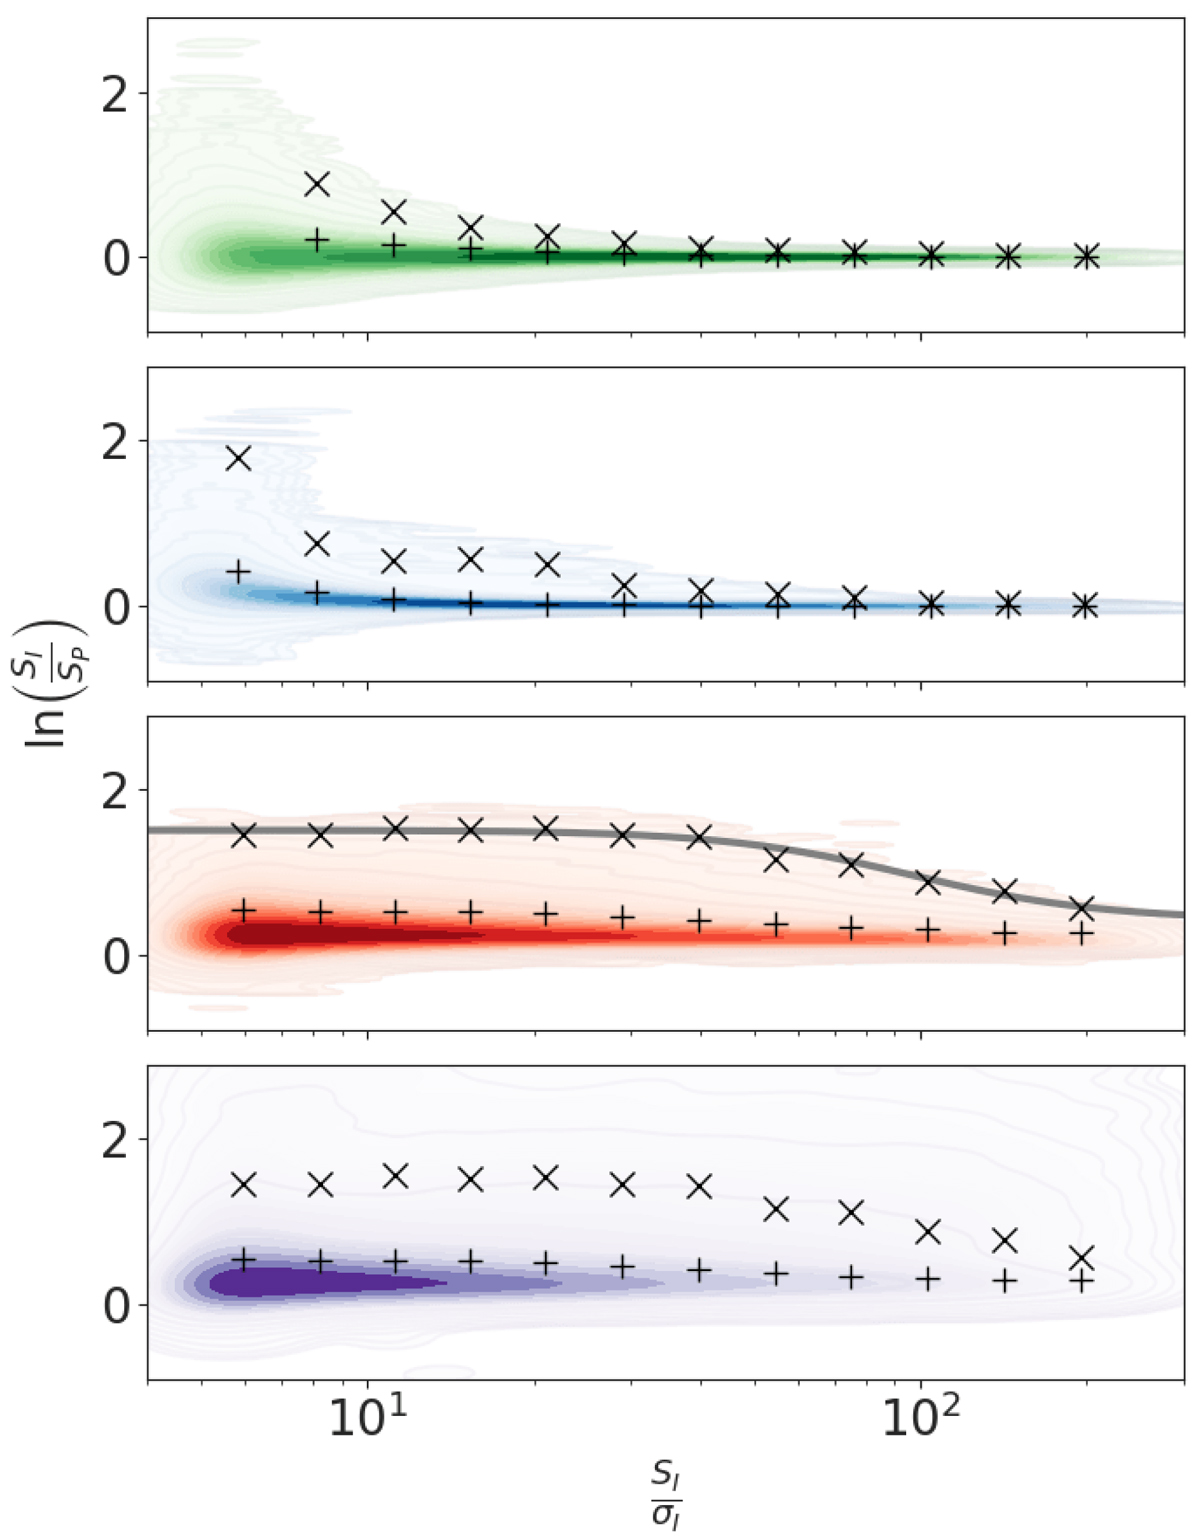
Fig. 6.
Download original image
Ratio of integrated flux density to peak brightness as a function of signal to noise for populations of simulated and real LoTSS-DR2 sources. The green (top) curve shows the idealised distribution where there is no bias in the detections and the noise in the integrated flux density and peak brightness are uncorrelated. The blue (second from top) curve is a population of point-like sources that were injected into images with a Gaussian noise background and catalogued using PYBDSF. The red (second from bottom) and purple (bottom) curves show populations of compact and all LoTSS-DR2 sources respectively. In each of the four distributions the + and × symbols show the 84.1 and 99.9 percentile levels in different signal to noise bins. If the data were described by a Gaussian distribution, which is only the case for the green points, these would correspond to the standard deviation and 3× the standard deviation respectively. The sigmoid function we have defined for separating extended and point-like sources is shown with the grey line fitted to the 99.9 percentile level of the population of compact LoTSS-DR2 sources (red points).
Current usage metrics show cumulative count of Article Views (full-text article views including HTML views, PDF and ePub downloads, according to the available data) and Abstracts Views on Vision4Press platform.
Data correspond to usage on the plateform after 2015. The current usage metrics is available 48-96 hours after online publication and is updated daily on week days.
Initial download of the metrics may take a while.