Fig. 22.
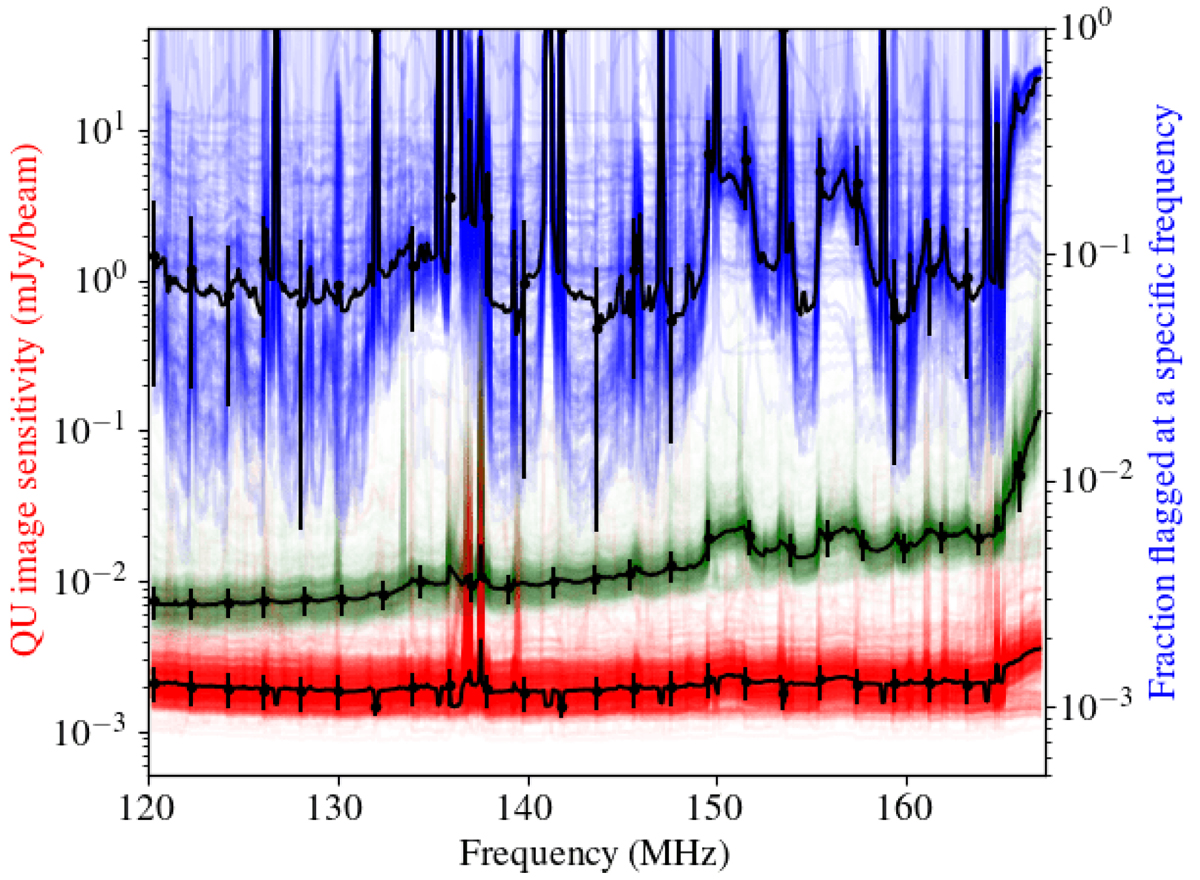
Download original image
Sensitivity of our Stokes Q and U image cubes as a function of frequency shown in green (4′ resolution) and red (20″ resolution). The fraction of data flagged in our LoTSS-DR2 datasets as a function of frequency is the key contributing factor to the variation in noise levels and is shown in blue. For each plot the individual coloured lines show the properties of each image cube or dataset where the black line, and corresponding errors, show the median values at a particular frequency plus/minus the standard deviation amongst the 841 different LoTSS pointings.
Current usage metrics show cumulative count of Article Views (full-text article views including HTML views, PDF and ePub downloads, according to the available data) and Abstracts Views on Vision4Press platform.
Data correspond to usage on the plateform after 2015. The current usage metrics is available 48-96 hours after online publication and is updated daily on week days.
Initial download of the metrics may take a while.