Fig. 20.
Download original image
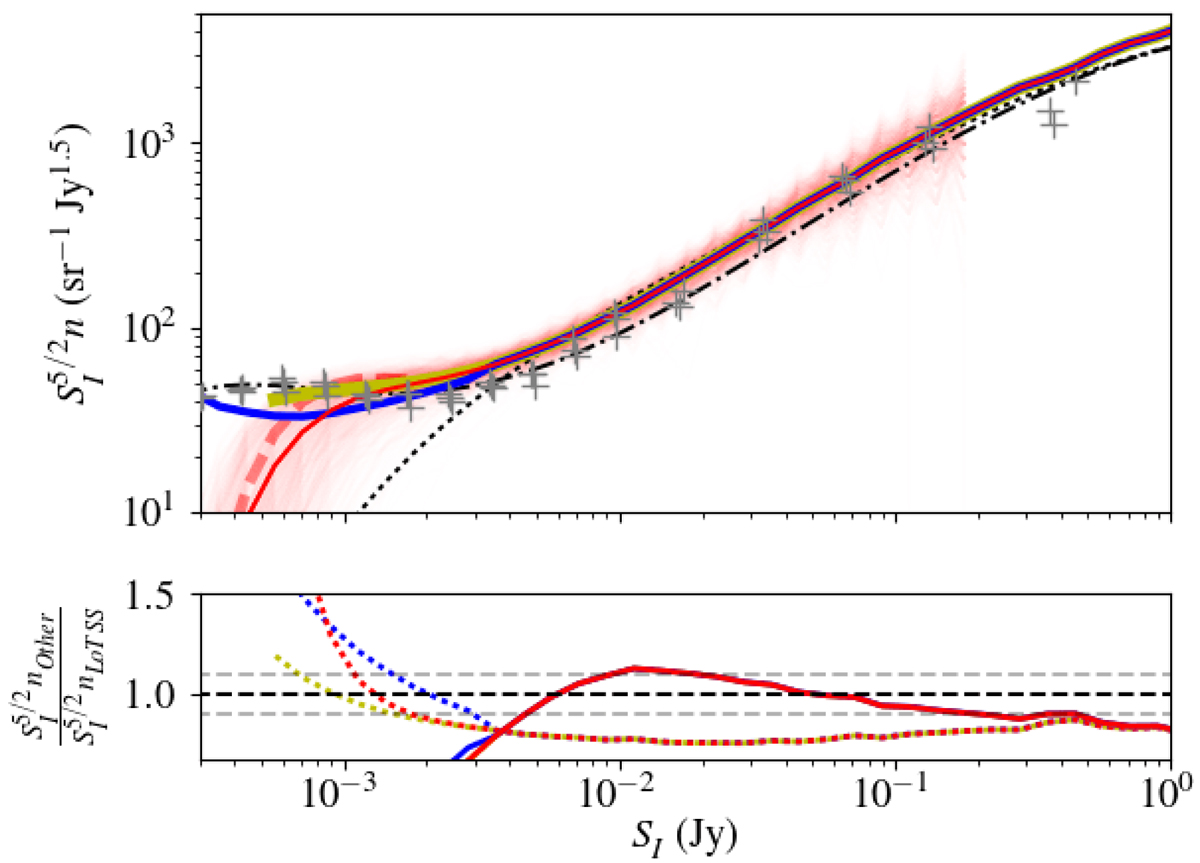
120–168 MHz Euclidean normalized differential source counts derived from LoTSS-DR2 PYBDSF catalogues. The completely uncorrected source counts are shown in the top panel with transparent red solid lines showing those derived from individual pointings for flux density bins where at least 90% of the pointings contain more than 10 sources. The opaque red solid line shows the combined uncorrected counts from all mosaics thus spanning the entirety of LoTSS-DR2. The solid yellow line shows the counts produced from only highly complete (at least 90% of sources detected at a given threshold) LoTSS-DR2 regions (Method One in Sect. 3.8). The solid blue line shows counts that are corrected for incompleteness using the simulations that are detailed in Sect. 3.6 (Method Two in Sect. 3.8). The simulations where sources are injected according to the Mandal et al. (2021) source count fit and recovered with PYBDSF are shown by the thick red dashed line. The black dashdot line shows the Mandal et al. (2021) fitted counts, the black dotted line shows the Intema et al. (2017) fitted counts and the grey +’s show the sources counts of the three different fields analysed by Mandal et al. (2021) that were combined in their fitting. Poisson errors on our counts are too small to be seen but the variation amongst the different mosaics (transparent red lines) reflects the level of agreement between different regions in LoTSS-DR2. In the bottom panel we show the ratio of the Intema et al. (2017) (solid lines) and Mandal et al. (2021) (dotted lines) source counts compared to those from LoTSS-DR2 (colour scheme the same as the top panel). The black and grey horizontal dashed lines mark a source counts ratio of 1.0 and 1.0 ± 0.1 respectively.
Current usage metrics show cumulative count of Article Views (full-text article views including HTML views, PDF and ePub downloads, according to the available data) and Abstracts Views on Vision4Press platform.
Data correspond to usage on the plateform after 2015. The current usage metrics is available 48-96 hours after online publication and is updated daily on week days.
Initial download of the metrics may take a while.