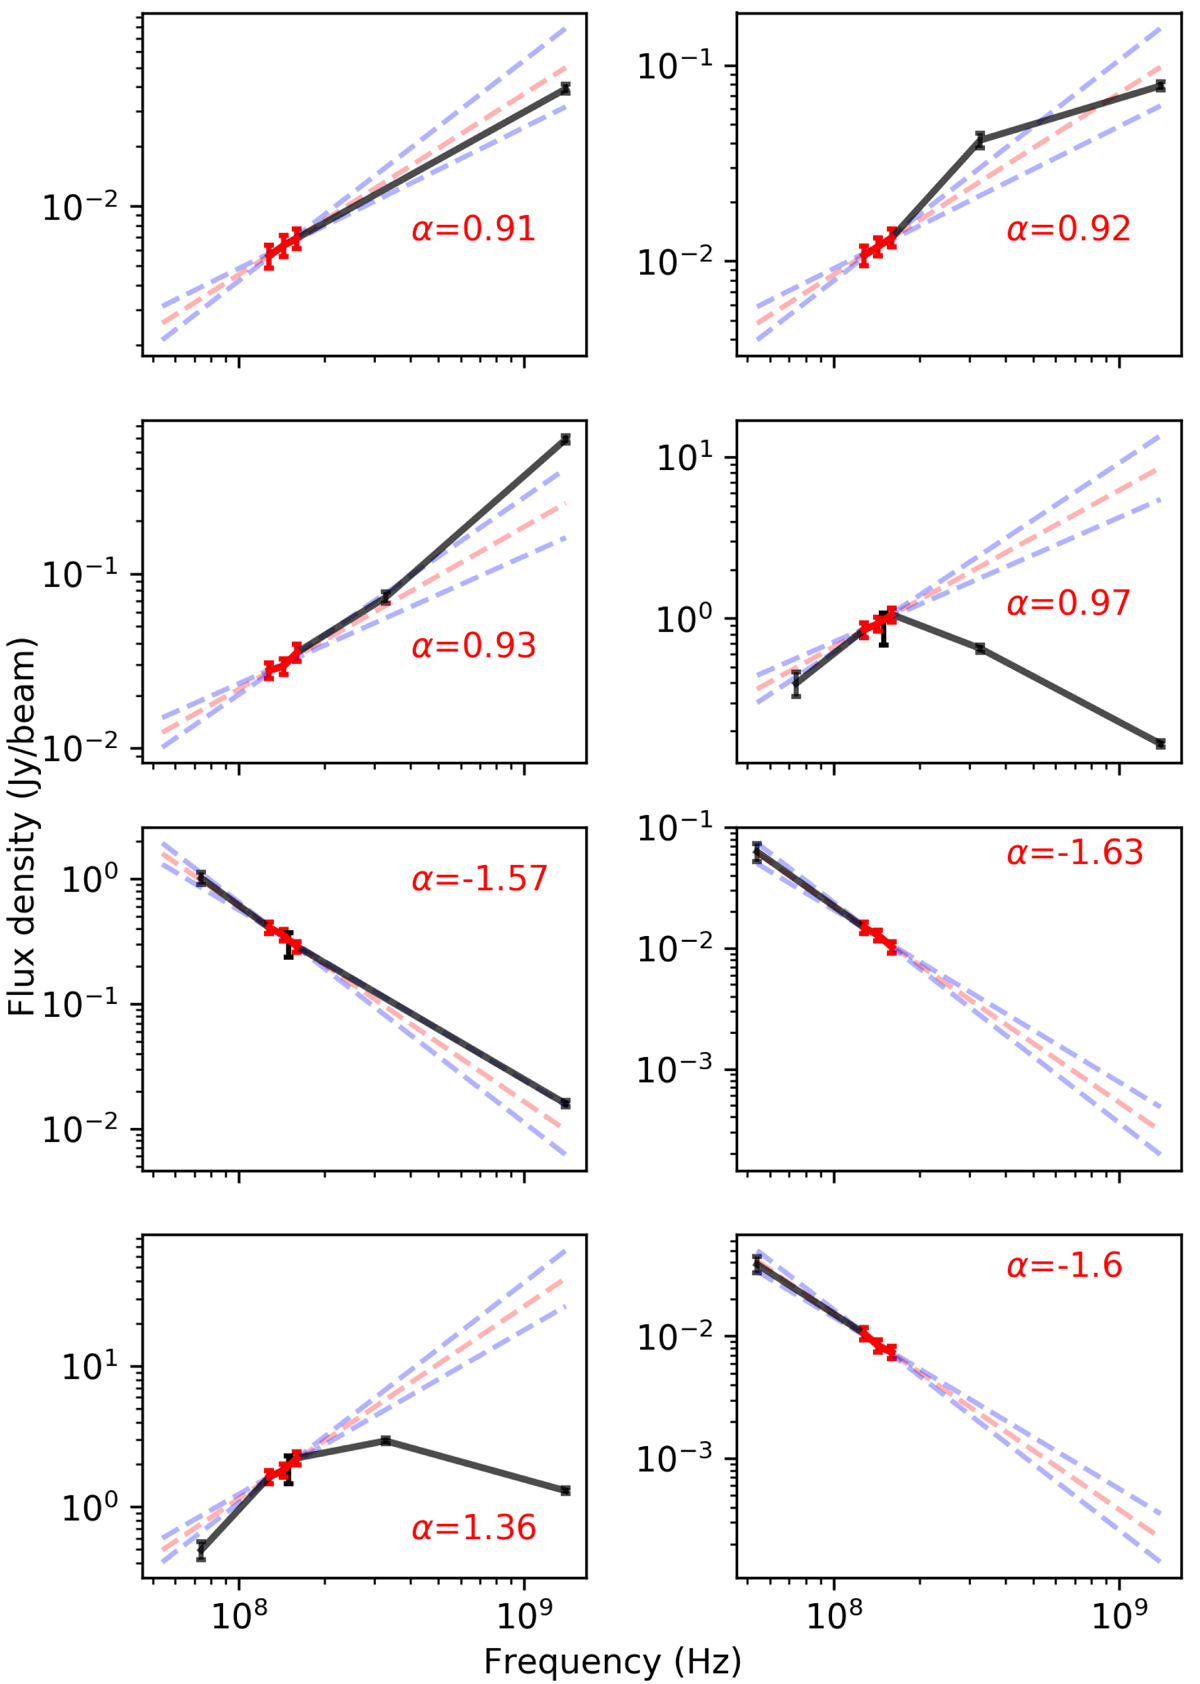
Fig. 19.
Download original image
Examples of sources with extreme in-band LoTSS spectral indices. The in-band LoTSS measurements are shown in red where the red dotted line shows the fitted α (values of α are displayed on the panels) and the blue dotted lines show the fitted α ± 0.2. The black points show measurements from LoLSS, VLSSr, TGSS, WENSS and NVSS where available. Clockwise from top left, the sources shown are: ILTJ004259.17+233517.1, ILTJ084911.00+403231.2, ILTJ101731.34+434312.5, ILTJ113903.61+583040.5, ILTJ125903.65 +594635.9, ILTJ082236.93+511230.0, ILTJ011755.08+320622.5 and ILTJ004259.17+233517.1.
Current usage metrics show cumulative count of Article Views (full-text article views including HTML views, PDF and ePub downloads, according to the available data) and Abstracts Views on Vision4Press platform.
Data correspond to usage on the plateform after 2015. The current usage metrics is available 48-96 hours after online publication and is updated daily on week days.
Initial download of the metrics may take a while.