Fig. 18.
Download original image
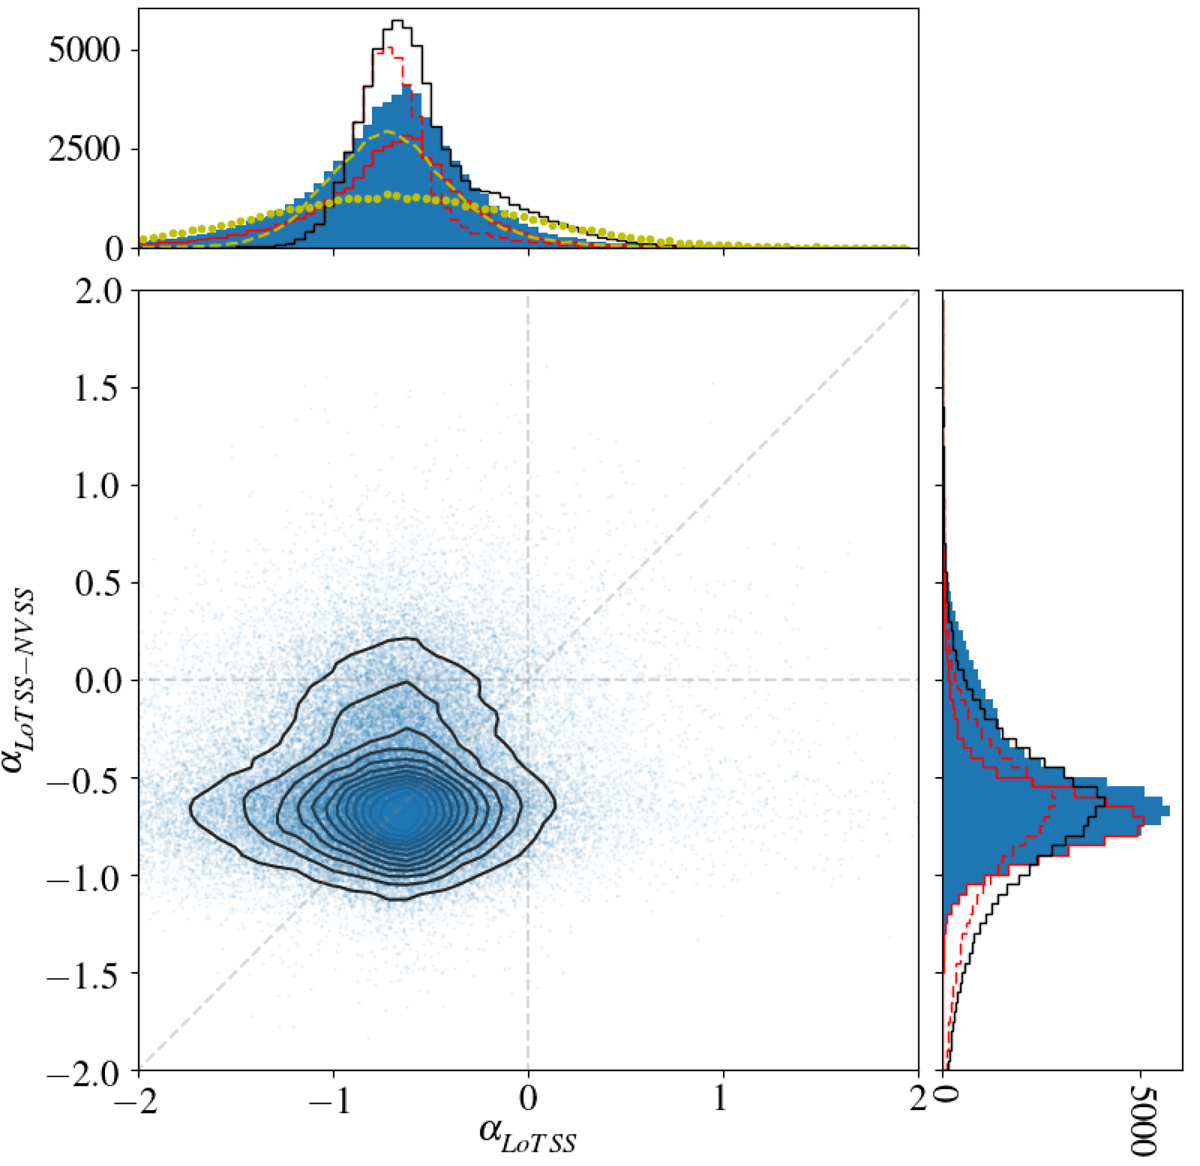
Derived LoTSS-NVSS and in-band LoTSS spectral index measurements for isolated, compact, fully deconvolved LoTSS-DR2 sources overlaid with contours showing the density of points. The solid blue histograms show the in-band LoTSS spectral index distribution (top) and the LoTSS-NVSS spectral index distribution (right) for all sources where we have both measurements. The histograms outlined in black show the LoTSS-NVSS spectral index distribution of these sources overlaid on the in-band LoTSS spectral index distribution or vice versa. The solid and dashed red lines show the spectral index values derived from only bright (LoTSS SI > 30 mJy beam−1) LoTSS sources for in-band and LoTSS-NVSS (top) and LoTSS-NVSS and in-band (right) respectively. The dotted and the dashed yellow histograms (top) show the results from simulations where the LoTSS-NVSS spectral index values of bright (LoTSS SI > 30 mJy beam−1) sources, and associated errors, are used to simulate LoTSS in-band flux densities which are then fitted with a power law to give a spectral index. Here flux densities for each band and source are extrapolated from the LoTSS-NVSS spectral index and LoTSS continuum measurement plus a random error drawn from a Gaussian with a standard deviation equal to 10% (dotted) or 3% (dashed) of the flux density (mimicking a flux density scale alignment uncertainty) added in quadrature to the statistical uncertainty from the PYBDSF estimation of noise local to the source.
Current usage metrics show cumulative count of Article Views (full-text article views including HTML views, PDF and ePub downloads, according to the available data) and Abstracts Views on Vision4Press platform.
Data correspond to usage on the plateform after 2015. The current usage metrics is available 48-96 hours after online publication and is updated daily on week days.
Initial download of the metrics may take a while.