Fig. 17.
Download original image
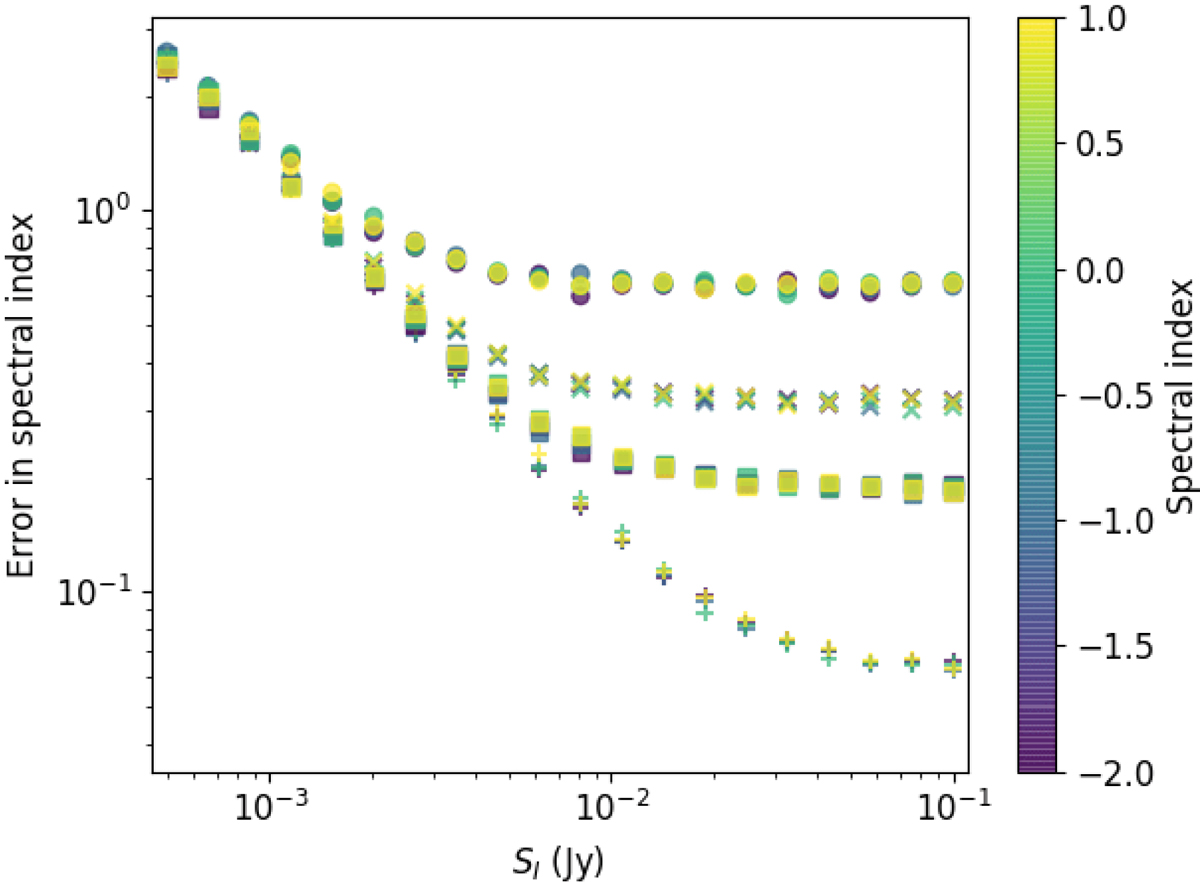
Simulated measurement error in spectral index as a function of SI where the marker colour indicates the simulated spectral index (α). The simulation assumes an independent 10% (circles), 5% (×’s), 3% (boxes), or 1% (+’s) flux density alignment uncertainty on each in-band image which are added in quadrature to the image noise values of 220, 195 and 190 μJy beam−1 for the 128.0, 143.7 and 160.2 MHz in-band images respectively. The spectral index errors were calculated by simulating 1000 sources at each flux density, spectral index and flux density alignment uncertainty and computing the standard deviation of the recovered spectral index values.
Current usage metrics show cumulative count of Article Views (full-text article views including HTML views, PDF and ePub downloads, according to the available data) and Abstracts Views on Vision4Press platform.
Data correspond to usage on the plateform after 2015. The current usage metrics is available 48-96 hours after online publication and is updated daily on week days.
Initial download of the metrics may take a while.