Fig. 16.
Download original image
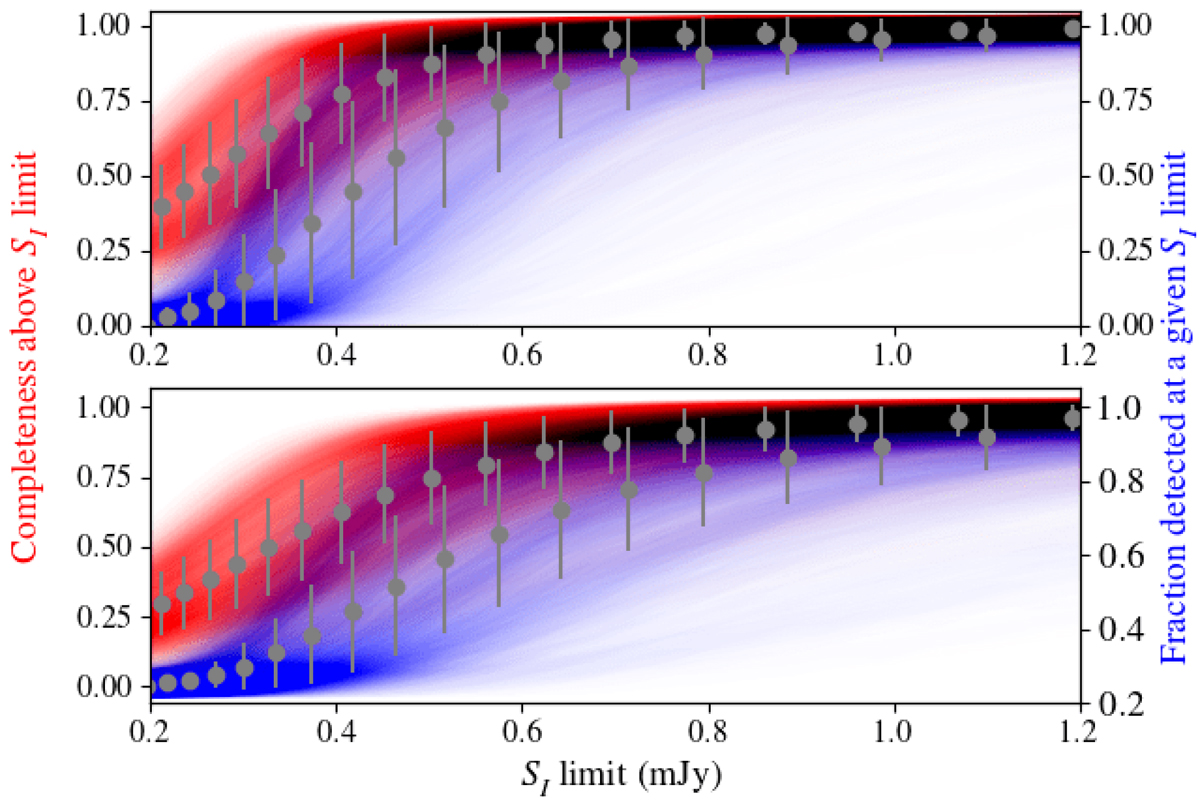
Point source completeness, or fraction of simulated sources detected above some SI limit, of LoTSS-DR2 for genuinely point-like sources (top) and for real point-like sources as defined from their recovered deconvolution models (bottom). Each red line shows the completeness derived from approximately 370 000 sources that are injected into each of the 841 DR2 mosaics through a series of 10 simulations with realistic source density and flux density distributions. The overlaid grey points represent the mean between the different mosaics weighted by the area covered by the mosaics and the error bars show ± the standard deviation of the different mosaic values. Due to the number of sources injected into the maps the Poisson errors are negligible by comparison. The fraction of sources detected at a given flux density are also shown with blue lines where grey points again show the corresponding weighted mean values as a function of flux density.
Current usage metrics show cumulative count of Article Views (full-text article views including HTML views, PDF and ePub downloads, according to the available data) and Abstracts Views on Vision4Press platform.
Data correspond to usage on the plateform after 2015. The current usage metrics is available 48-96 hours after online publication and is updated daily on week days.
Initial download of the metrics may take a while.