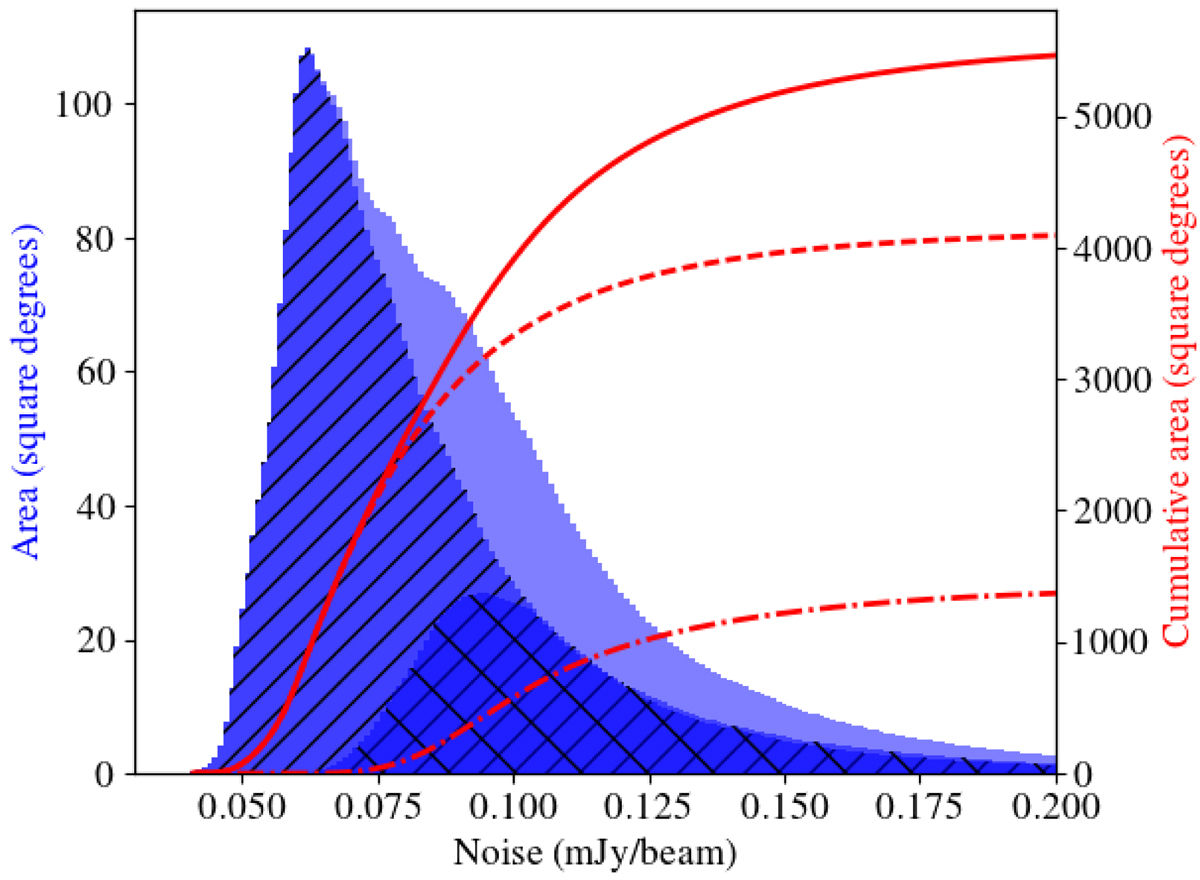
Fig. 14.
Download original image
Overall rms distribution of LoTSS-DR2 shown in the light blue histogram (y-axis on the left). The contributions from the RA-13 and RA-1 regions are shown by the darker blue histograms with \ and / hatchings respectively. The rms distributions of the two regions are approximately equal above 0.1 mJy beam−1 but otherwise the RA-13 region is on average higher declination and therefore generally more sensitive than the RA-1 region. The median and mean of the rms are 83 μJy beam−1 and 95 μJy beam−1 over the entire LoTSS-DR2 region where 90% and 95% is below 140 and 170 μJy beam−1 respectively. The solid red line shows the cumulative area of the entire LoTSS-DR2 region with an rms noise below a given value with the dashed and dashdot lines showing the same but for the RA-13 and RA-1 regions (y-axis on the right).
Current usage metrics show cumulative count of Article Views (full-text article views including HTML views, PDF and ePub downloads, according to the available data) and Abstracts Views on Vision4Press platform.
Data correspond to usage on the plateform after 2015. The current usage metrics is available 48-96 hours after online publication and is updated daily on week days.
Initial download of the metrics may take a while.