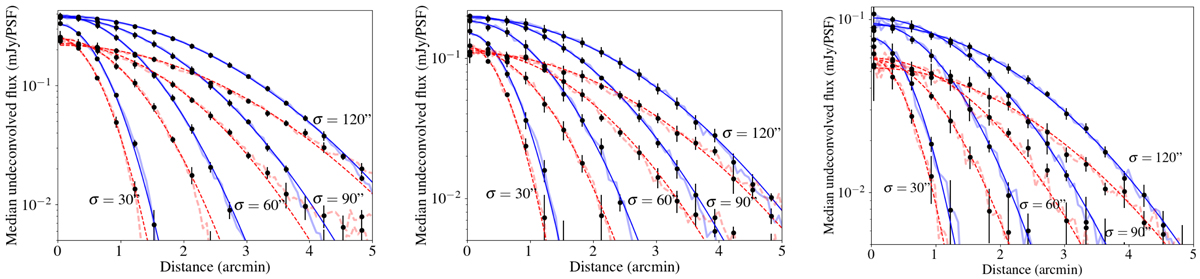
Fig. 11.
Download original image
Recovery of unmodelled flux density in the LoTSS-DR2 pipeline for highly extended sources. Four Gaussian profiles (with standard deviations of 30, 60, 90, 120″) with different peak brightness levels (10 μJy pixel−1, 5 μJy pixel−1 and 2.5 μJy pixel−1 from left to right) are each injected 5 times into LoTSS-DR2 uv-data prior to a direction dependent calibration step using a skymodel that does not include their emission. The black error bars and thicker lines show the median and the standard deviation of the image brightness values as a function of distance for each of the different injected profiles. The thin solid lines are the best fit profiles to these median values. Blue lines correspond to values derived from the undeconvolved pre direction dependent calibrated image (i.e. image from Step. 3 or the centre panel in Fig. 12) and the red lines correspond to the undeconvolved post direction dependent calibrated images (i.e. image from Step. 5 or the right panel in Fig. 12). Overall, by integrating the simulated and recovered signal out to five standard deviations from the Gaussian centoid we find that in this worst-case scenario typically 60 ± 6% of injected but completely unmodelled flux density is recovered after direction dependent calibration.
Current usage metrics show cumulative count of Article Views (full-text article views including HTML views, PDF and ePub downloads, according to the available data) and Abstracts Views on Vision4Press platform.
Data correspond to usage on the plateform after 2015. The current usage metrics is available 48-96 hours after online publication and is updated daily on week days.
Initial download of the metrics may take a while.