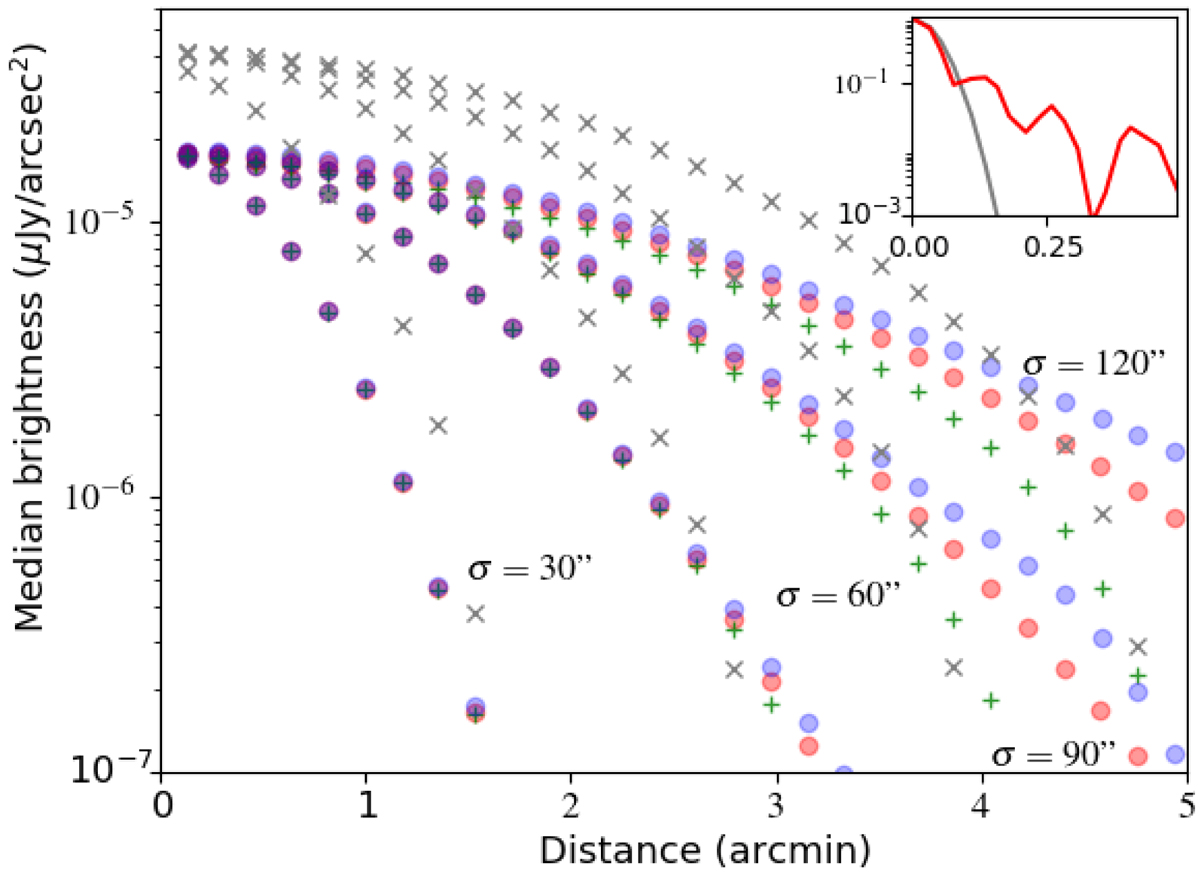
Fig. 10.
Download original image
Recovery of simulated Gaussian skymodels of varying width and brightness that are injected into calibrated uv-data. The red points show the brightness as a function of distance from the centroid of the simulated skymodels convolved by a Gaussian with a size that matches the restoring beam dimensions. The blue points show the profile of the emission recovered in the restored image created from the simulated uv-data. The green ‘+’ symbols show the flux density in the corresponding model image created during the deconvolution of the simulated uv-data that has been convolved with a Gaussian with a size that matches the restoring beam. The ‘×’ symbols show the flux density in the undeconvolved image of the uv-data. The different profiles show the different values of standard deviations of the injected Gaussian profile. When the emission is deconvolved the model injected into the data matches the profile and flux density of the emission recovered in the restored image. However, when the emission is not fully deconvolved (e.g., in the undeconvolved image or in the restored image where the emission becomes very faint) the apparent flux density can be either severely overestimated or underestimated and can be highly misleading due to the mismatch in area of the synthesised (red) and restoring beams (grey) which are shown in the inset.
Current usage metrics show cumulative count of Article Views (full-text article views including HTML views, PDF and ePub downloads, according to the available data) and Abstracts Views on Vision4Press platform.
Data correspond to usage on the plateform after 2015. The current usage metrics is available 48-96 hours after online publication and is updated daily on week days.
Initial download of the metrics may take a while.