Open Access
Fig. 9.
Download original image
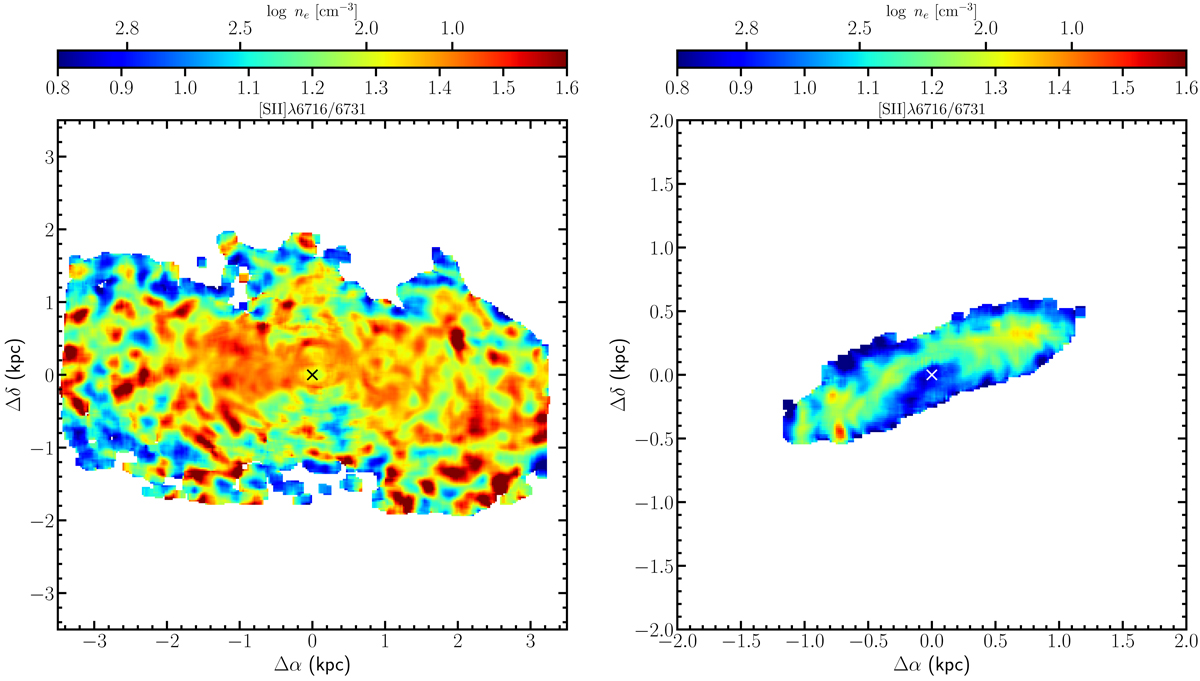
Distribution of the [SII]λ6716 Å/[SII]λ6731 Å ratio for emission lines with an S/N > 5 extracted from the MUSE data of the galaxies NGC 4469 (left) and NGC 4526 (right). The black and white crosses show the position of the photometric centre.
Current usage metrics show cumulative count of Article Views (full-text article views including HTML views, PDF and ePub downloads, according to the available data) and Abstracts Views on Vision4Press platform.
Data correspond to usage on the plateform after 2015. The current usage metrics is available 48-96 hours after online publication and is updated daily on week days.
Initial download of the metrics may take a while.