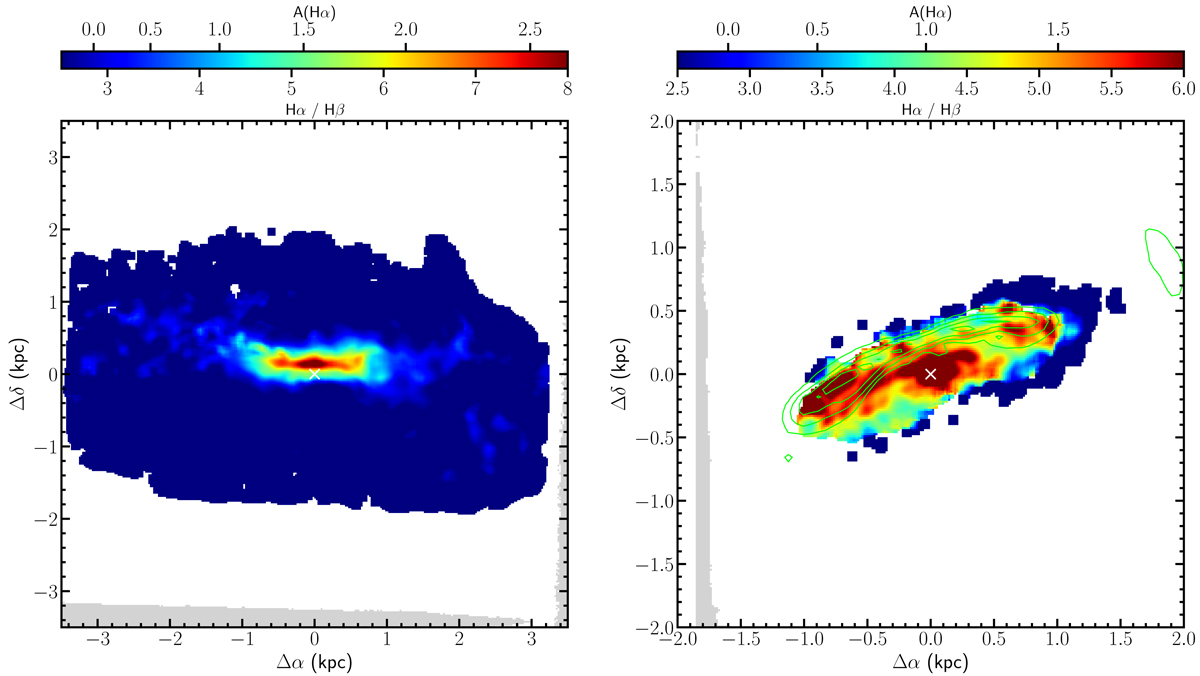
Fig. 8.
Download original image
Distribution of the Balmer decrement derived using the Hβ and Hα lines with an S/N > 5 extracted from the MUSE data in the galaxies NGC 4469 (left) and NGC 4526 (right). The white crosses show the position of the photometric centre. The green contours in NGC 4526 indicate Ag = 0.1, 0.3, 0.5, and 0.7 mag attenuation derived from the g-band NGVS image, as described in Sect. 4.4.
Current usage metrics show cumulative count of Article Views (full-text article views including HTML views, PDF and ePub downloads, according to the available data) and Abstracts Views on Vision4Press platform.
Data correspond to usage on the plateform after 2015. The current usage metrics is available 48-96 hours after online publication and is updated daily on week days.
Initial download of the metrics may take a while.