Fig. 21.
Download original image
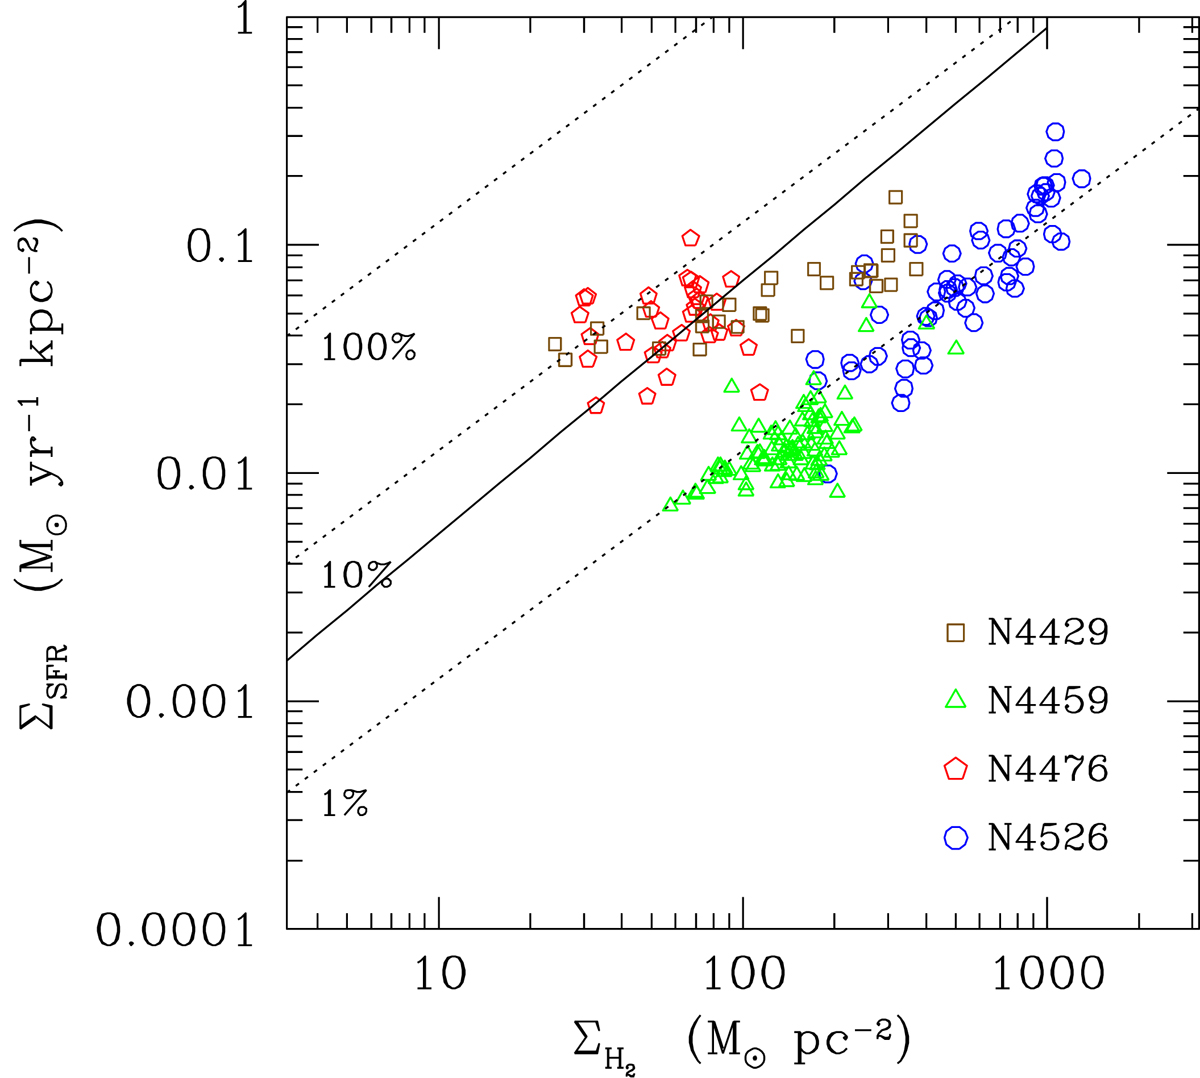
Relation between the star formation rate surface density and the molecular gas surface density at scales of ≃100 pc. Different symbols indicate different galaxies. The solid black line shows the best fit obtained by Bigiel et al. (2008) (scaled to the same XCO conversion factor) for the Heracles sample of nearby galaxies using star formation rates derived from Hα+24μm flux surface densities. The dotted lines show lines of constant star formation efficiency, indicating the level of ΣSFR needed to consume 1%, 10%, and 100% of the gas reservoir (including helium) in 108 years, corresponding to depletion times of 108, 109, and 1010 years.
Current usage metrics show cumulative count of Article Views (full-text article views including HTML views, PDF and ePub downloads, according to the available data) and Abstracts Views on Vision4Press platform.
Data correspond to usage on the plateform after 2015. The current usage metrics is available 48-96 hours after online publication and is updated daily on week days.
Initial download of the metrics may take a while.