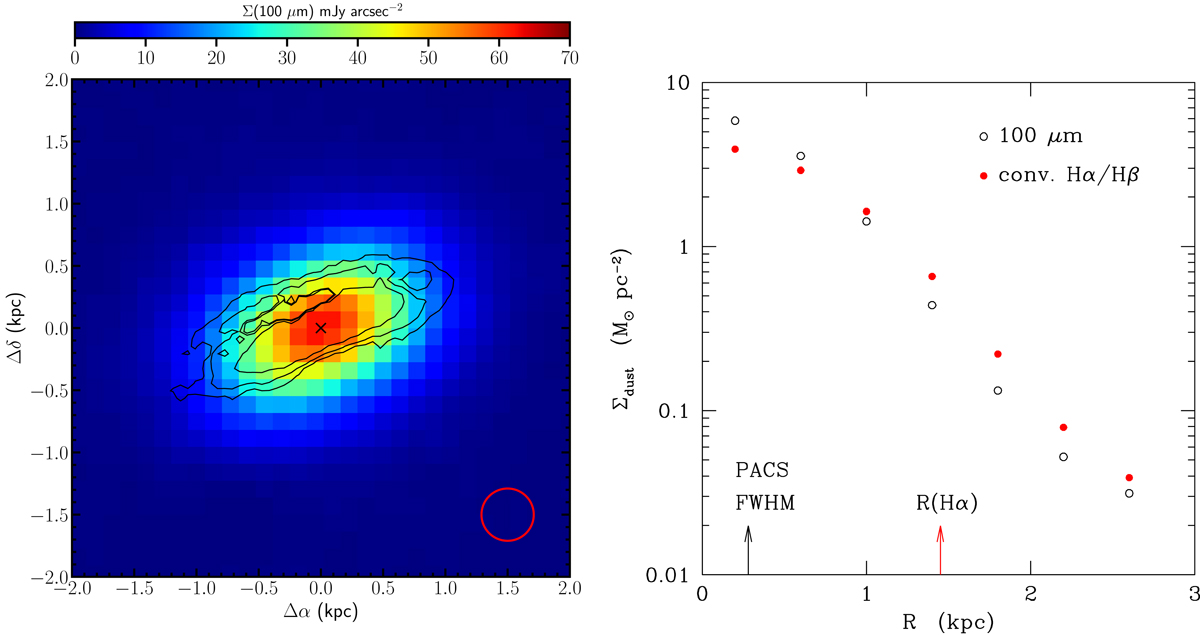
Fig. 18.
Download original image
Left: Herschel/PACS image of galaxy NGC 4526 at 100 μm (from Cortese et al. 2014), in units of mJy arcsec−2, with contour levels of the VESTIGE Hα emission (3 × 10⁻¹⁶, 6 × 10⁻¹⁶, 1.5 × 10⁻¹⁵ erg s−1 cm−2 arcsec−2). The black cross indicates the position of the galaxy centre. The red circle in the lower right corner gives the FWHM of the PACS data (7″). Right: radial variation of the dust surface density profile of NGC 4526 derived from the PACS 100 μm image (empty black circles) and from the E(B − V) 2D map derived using the Balmer decrement extracted from the MUSE data cube and brought to the same resolution as PACS, as described in the text (filled red circles). The vertical black and red arrows indicate the PACS FWHM and the extension of the Hα emitting disc.
Current usage metrics show cumulative count of Article Views (full-text article views including HTML views, PDF and ePub downloads, according to the available data) and Abstracts Views on Vision4Press platform.
Data correspond to usage on the plateform after 2015. The current usage metrics is available 48-96 hours after online publication and is updated daily on week days.
Initial download of the metrics may take a while.