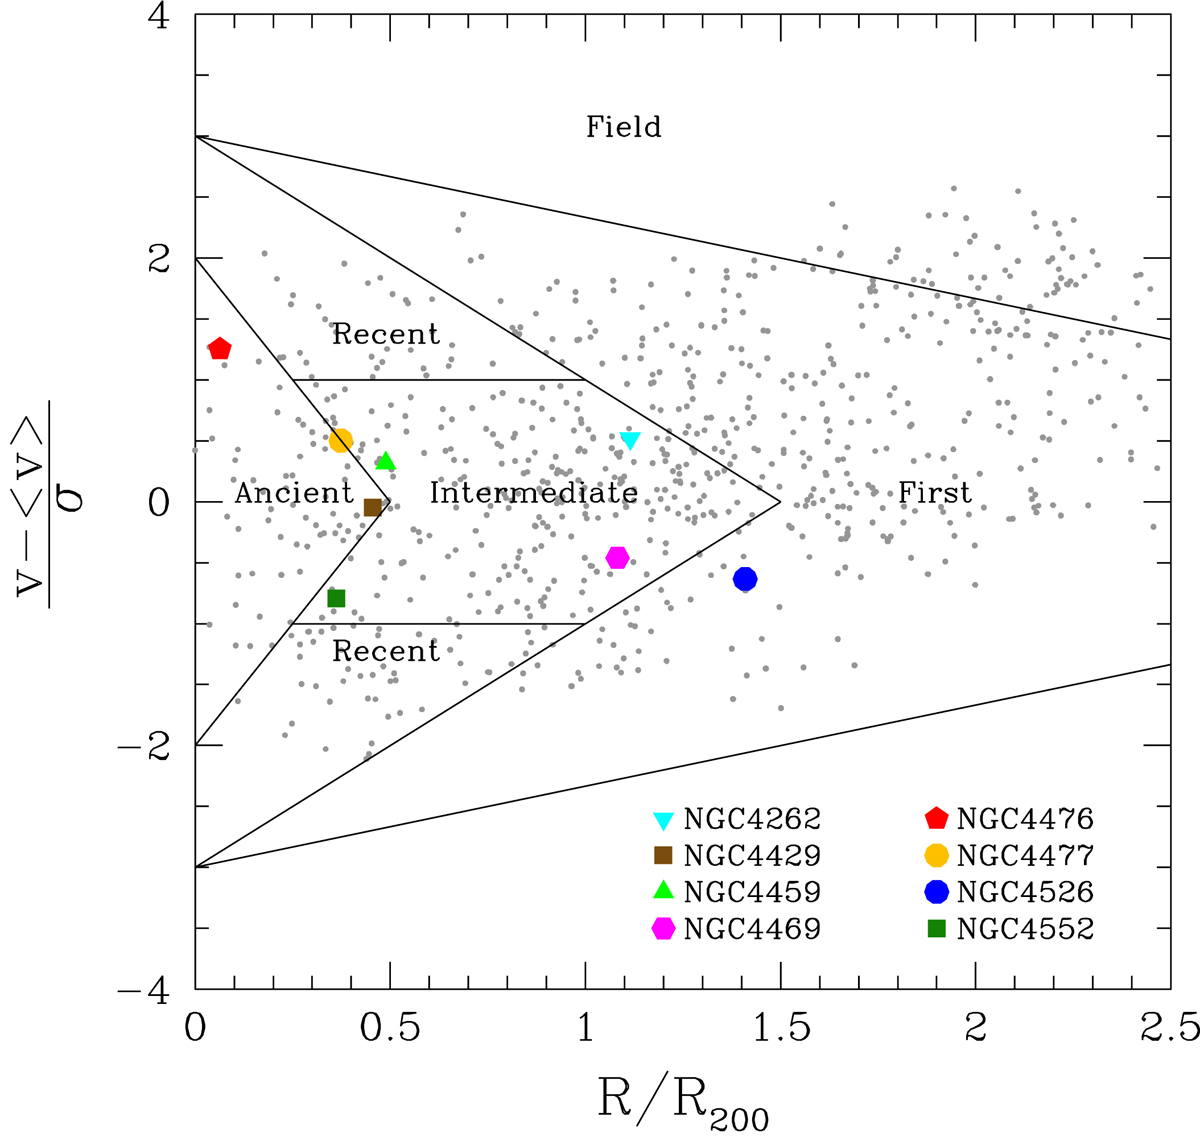
Fig. 16.
Download original image
Distribution of the eight lenticular galaxies within the phase-space diagram traced by galaxies within the Virgo cluster. Grey dots indicate the Virgo cluster galaxies with a recessional velocity < 3500 km s−1 extracted from the sample of Boselli et al. (2014a). The solid lines delimit the different regions extracted from the simulations of Rhee et al. (2017) to identify galaxies in different phases of their infall into the cluster: First (not yet fallen), recent (0 < τinf < 3.6 Gyr), intermediate (3.6 < τinf < 6.5 Gyr), and ancient (6.5 < τinf < 13.7 Gyr) infallers.
Current usage metrics show cumulative count of Article Views (full-text article views including HTML views, PDF and ePub downloads, according to the available data) and Abstracts Views on Vision4Press platform.
Data correspond to usage on the plateform after 2015. The current usage metrics is available 48-96 hours after online publication and is updated daily on week days.
Initial download of the metrics may take a while.