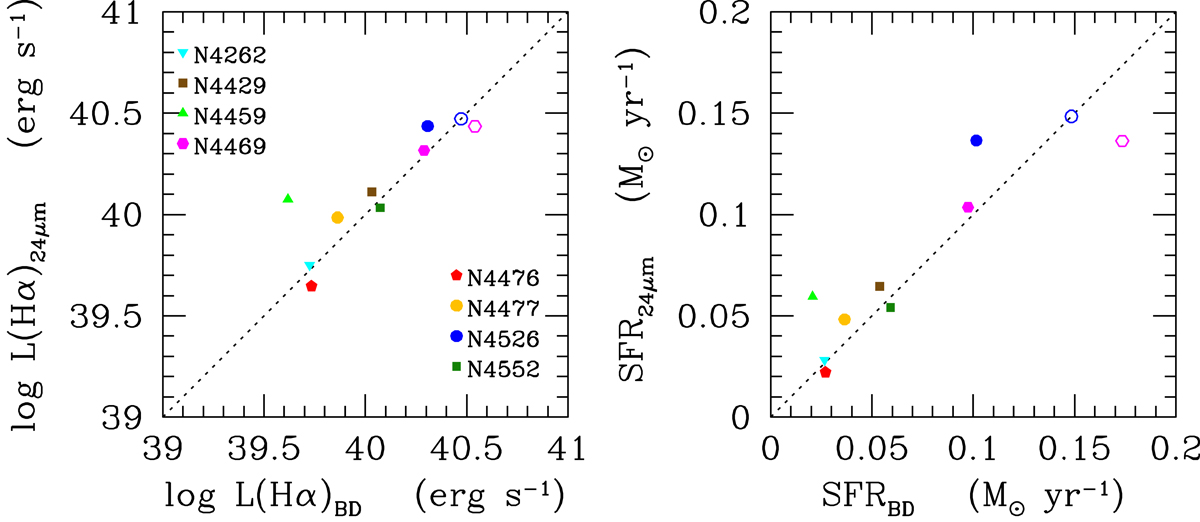
Fig. 13.
Download original image
Left: comparison between the Hα luminosity corrected for dust attenuation derived using the 24μm Spitzer/MIPS emission (L(Hα)24μm) and that derived using the Balmer decrement (L(Hα)BD), as described in the text. Both luminosities are corrected for [NII] contamination. Different symbols indicate different galaxies. Filled symbols are for Hα narrow-band data, and open symbols represent MUSE data. The dotted line shows the one-to-one relation. Right: same comparison for the star formation rates derived using the Kennicutt (1998a) calibration adapted for a Chabrier (2003) IMF.
Current usage metrics show cumulative count of Article Views (full-text article views including HTML views, PDF and ePub downloads, according to the available data) and Abstracts Views on Vision4Press platform.
Data correspond to usage on the plateform after 2015. The current usage metrics is available 48-96 hours after online publication and is updated daily on week days.
Initial download of the metrics may take a while.