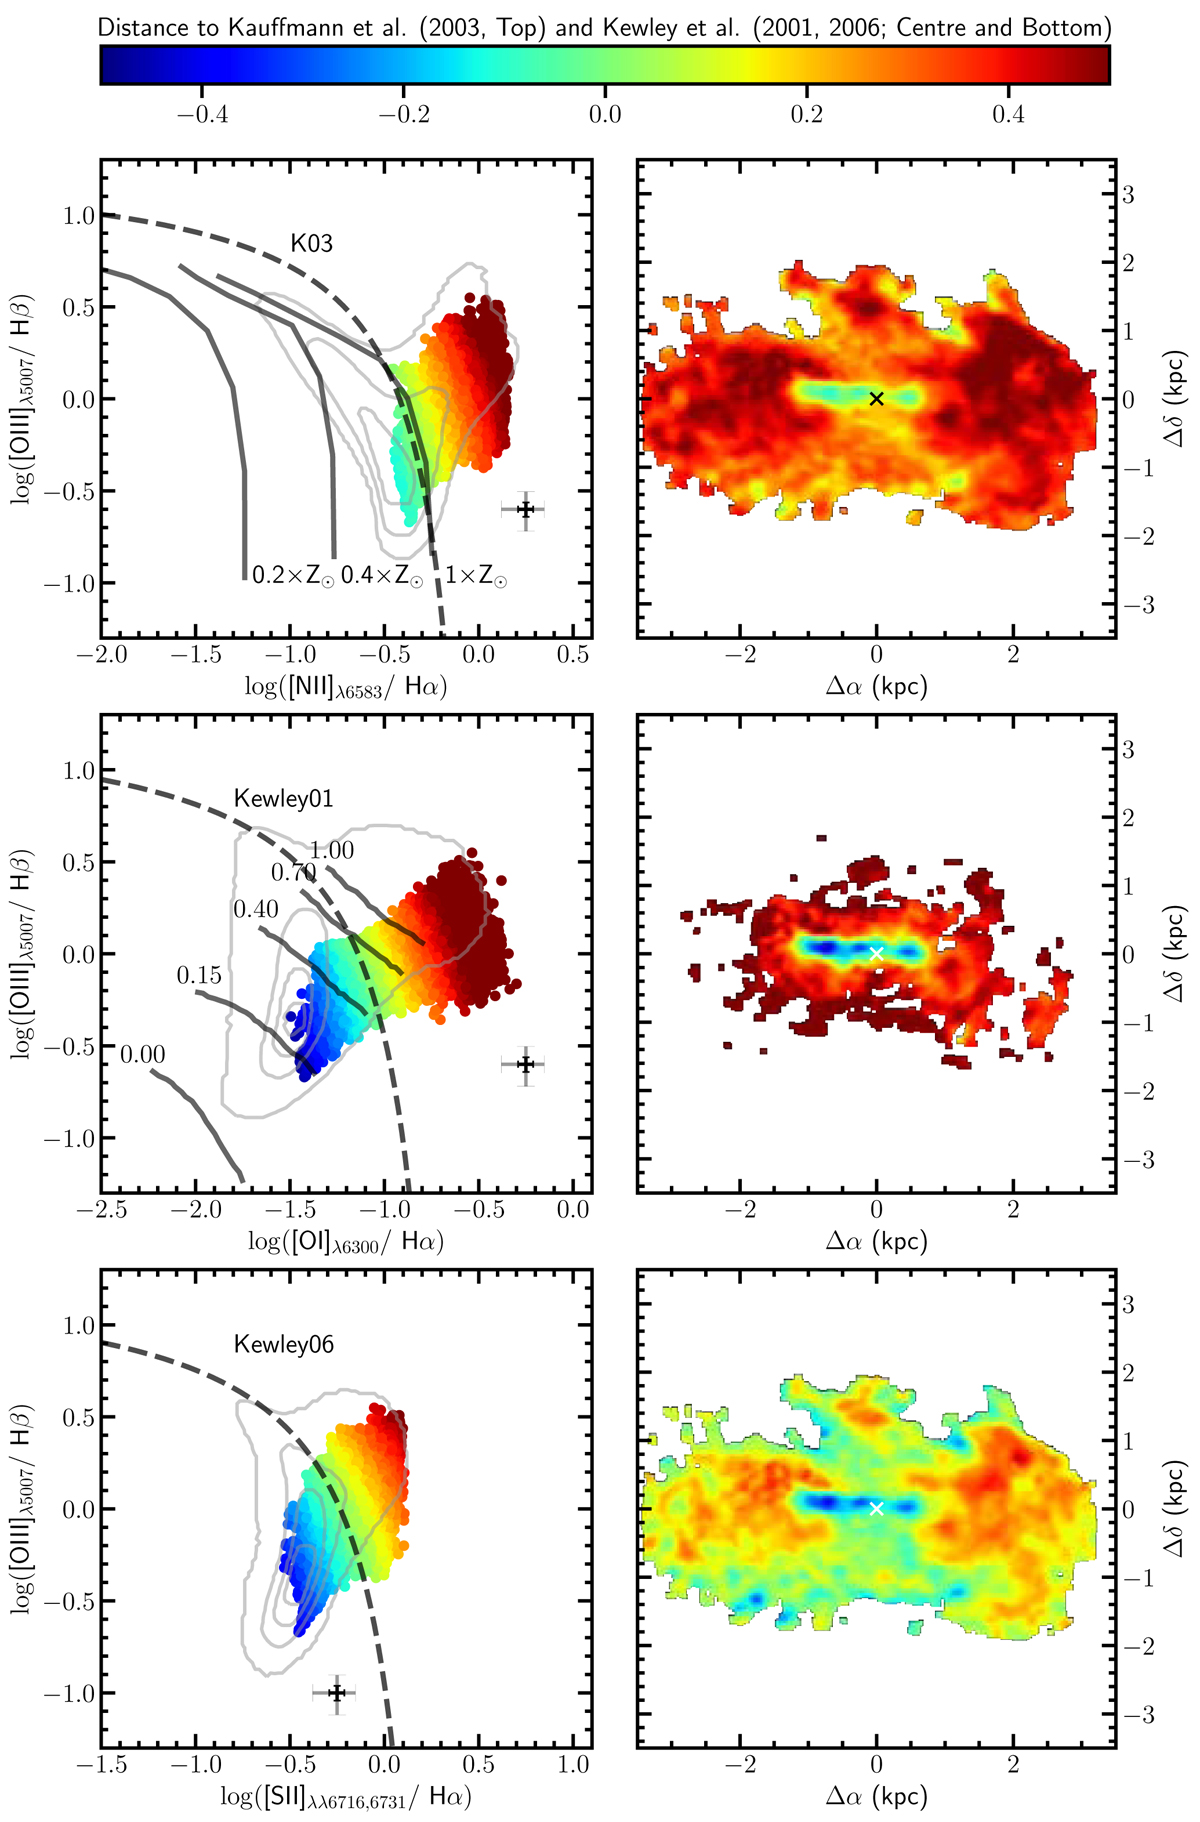
Fig. 11.
Download original image
2D diagnostic diagarms. Left: [OIII]/Hβ vs. [NII]/Hα (top), [OIII]/Hβ vs. [OI]/Hα (centre), and [OIII]/Hβ vs. [SII]/Hα (bottom) BPT diagrams for emission lines with an S/N > 5 in the galaxy NGC 4469. The dashed curves separate AGN from HII regions (Kauffmann et al. 2003; Kewley et al. 2001, 2006). Data are colour-coded according to their minimum distance from these curves. The black and grey crosses indicate the typical error on the data for lines with S/N ≃ 15 and S/N ≃ 5, respectively. The grey contours show the distribution of a random sample of nuclear spectra of SDSS galaxies in the redshift range 0.01–0.1 and stellar masses 109 ≤ Mstar ≤ 1011 M⊙. The thick solid lines in the upper left panel show three different photoionisation models at different metallicities (0.2, 0.4, and 1 Z⊙; Kewley et al. 2001). The lines in the middle left panel show the shock models of Rich et al. (2011) for increasing shock fractions (from left to right) in a twice-solar gas. Right: map of the spaxel distribution colour-coded according to their position in the BPT diagram. The black and white crosses indicate the position of the photometric centre of the galaxy.
Current usage metrics show cumulative count of Article Views (full-text article views including HTML views, PDF and ePub downloads, according to the available data) and Abstracts Views on Vision4Press platform.
Data correspond to usage on the plateform after 2015. The current usage metrics is available 48-96 hours after online publication and is updated daily on week days.
Initial download of the metrics may take a while.