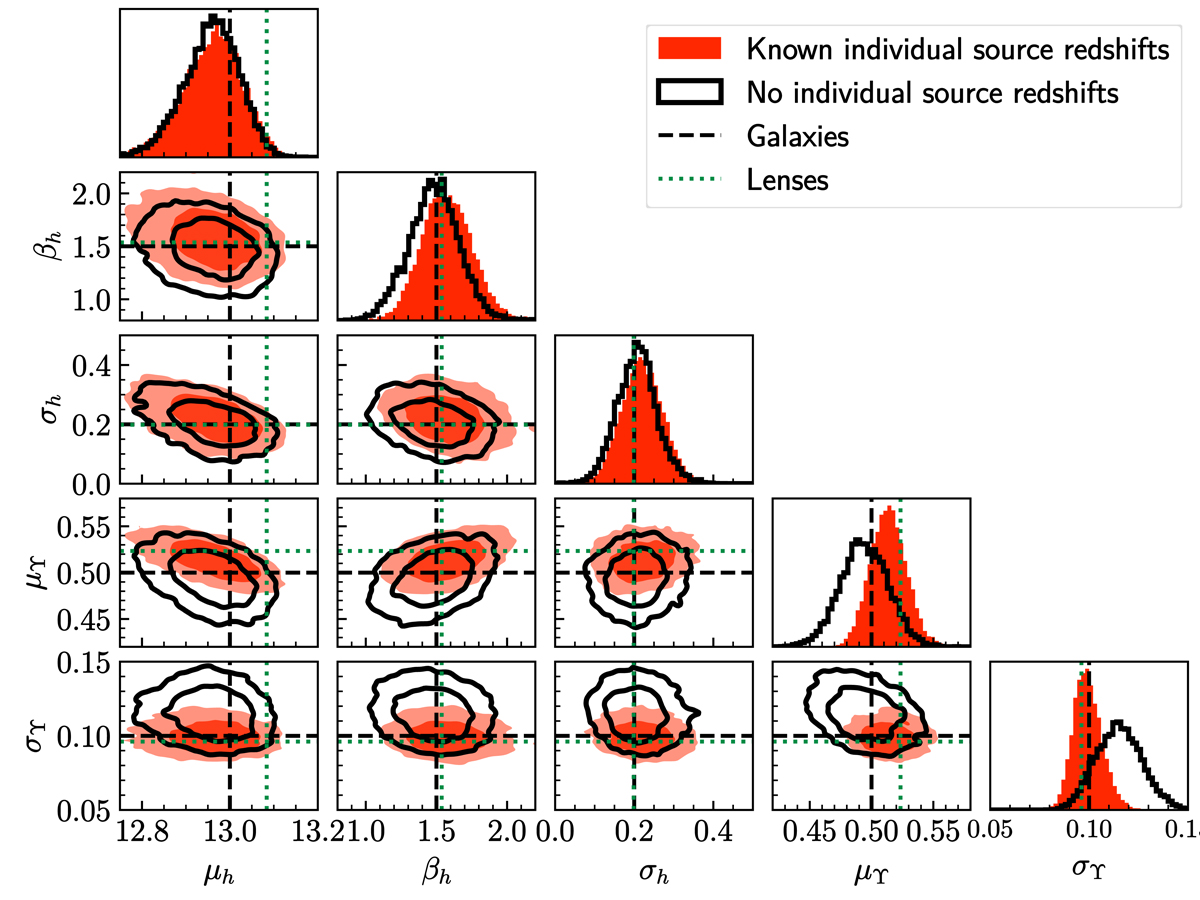
Fig. 3.
Download original image
Posterior probability distribution of the parameters describing the distribution in Mh and Υ* of the galaxy population, obtained by fitting the simulated sample of 137 strong lenses with the model of Sect. 4. Solid black contours show the inference obtained with no individual source redshift information. Red filled contours show the inference obtained with known individual source redshifts. Dashed black lines mark the true values of the parameters. Dotted green lines indicate the values of the parameters obtained by fitting the model to the subsample of strong lenses.
Current usage metrics show cumulative count of Article Views (full-text article views including HTML views, PDF and ePub downloads, according to the available data) and Abstracts Views on Vision4Press platform.
Data correspond to usage on the plateform after 2015. The current usage metrics is available 48-96 hours after online publication and is updated daily on week days.
Initial download of the metrics may take a while.