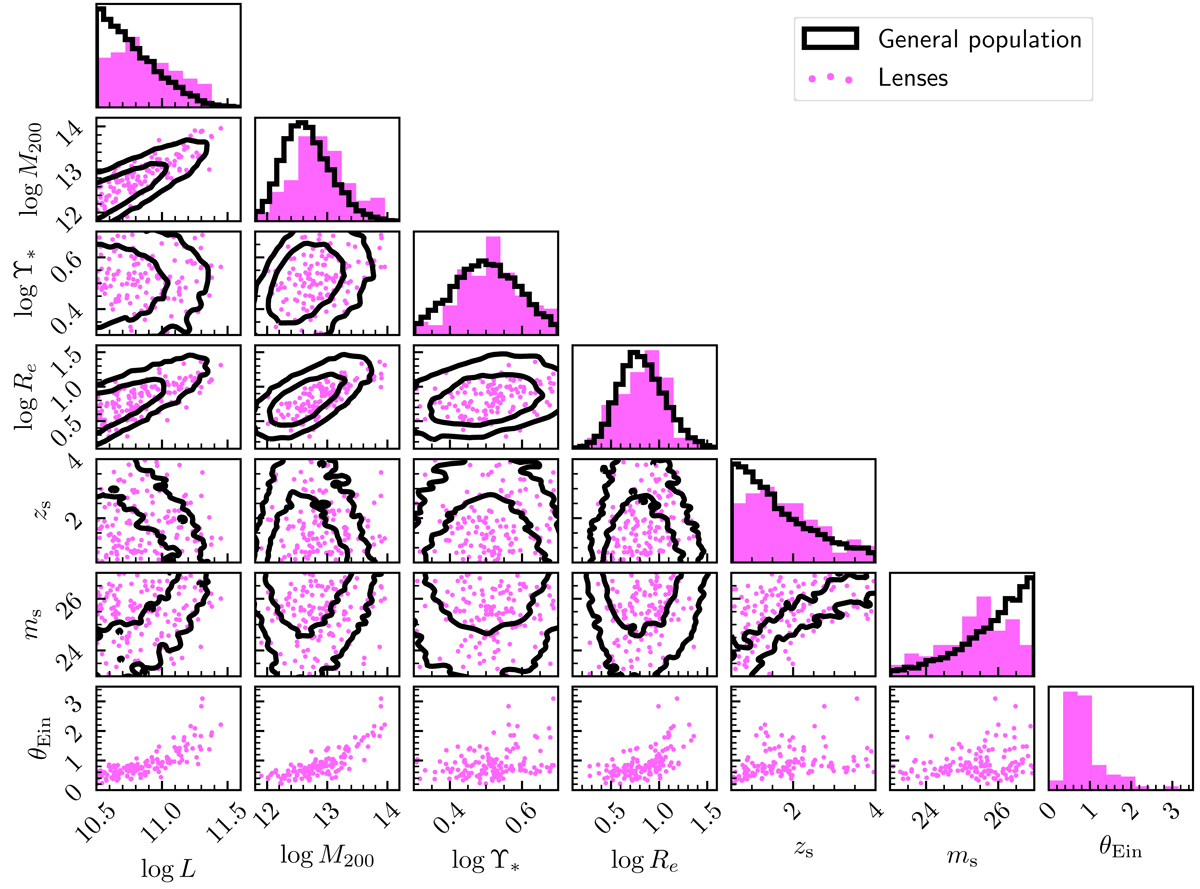
Fig. 1.
Download original image
Simulated sample. Solid lines show the distribution in the luminosity, halo mass, stellar mass-to-light ratio, and half-light radius of the general population of foreground galaxies as well as the distribution in redshift and i-band magnitude of the general population of background sources. Contour levels correspond to 68% and 95% enclosed probability. Pink points show the values of the above quantities, as well as of the Einstein radius, of the strong lenses. Histograms are normalised to one.
Current usage metrics show cumulative count of Article Views (full-text article views including HTML views, PDF and ePub downloads, according to the available data) and Abstracts Views on Vision4Press platform.
Data correspond to usage on the plateform after 2015. The current usage metrics is available 48-96 hours after online publication and is updated daily on week days.
Initial download of the metrics may take a while.