Free Access
Fig. 9
Download original image
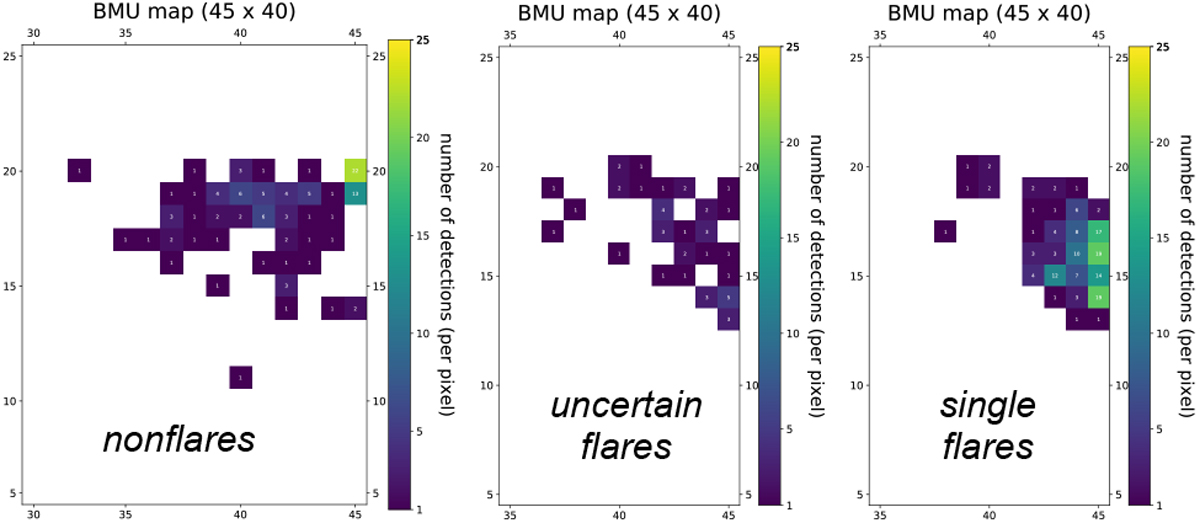
Distribution of visually inspected detections in blob 1. Single flares, uncertain flares, and nonflares are in the right, center, and left panels, respectively. All three panels have the same upper limit in the color bar for the purpose of direct comparison.
Current usage metrics show cumulative count of Article Views (full-text article views including HTML views, PDF and ePub downloads, according to the available data) and Abstracts Views on Vision4Press platform.
Data correspond to usage on the plateform after 2015. The current usage metrics is available 48-96 hours after online publication and is updated daily on week days.
Initial download of the metrics may take a while.