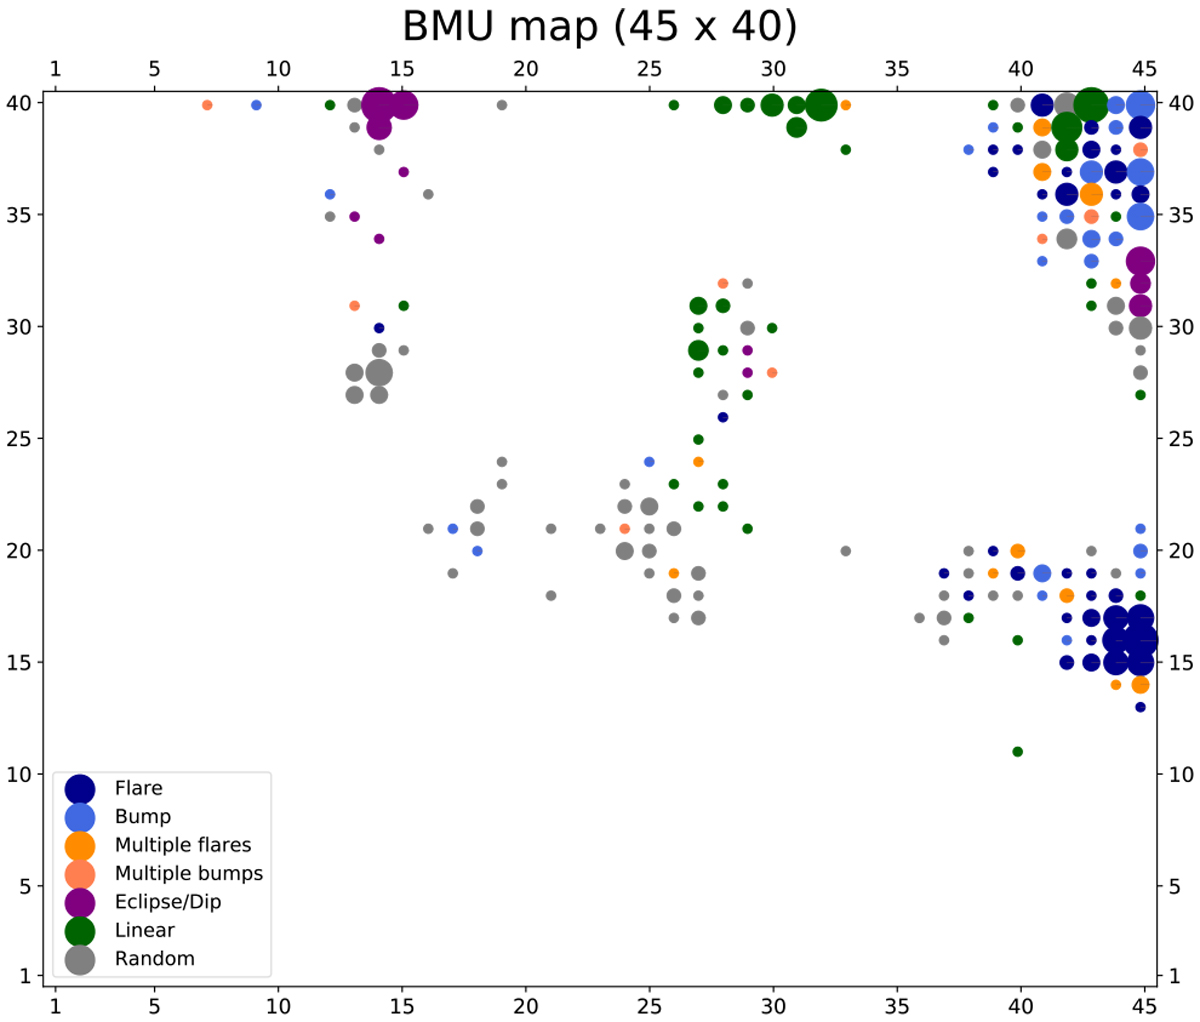
Fig. 7
Download original image
Classes of visually inspected variable detections. A quarter of nvar = 2654 was inspected and classes are presented as colored disks for each pixel. The most populated class at each pixel is shown. Flares are in dark blue, bumps in light blue, multiple flares in dark orange, multiple bumps in light orange, eclipses and dips in purple, linear in green, and random in gray. The size (area) of the disk corresponds to the number of detections belonging tothe most populated class in a given BMU pixel.
Current usage metrics show cumulative count of Article Views (full-text article views including HTML views, PDF and ePub downloads, according to the available data) and Abstracts Views on Vision4Press platform.
Data correspond to usage on the plateform after 2015. The current usage metrics is available 48-96 hours after online publication and is updated daily on week days.
Initial download of the metrics may take a while.