Free Access
Fig. 2
Download original image
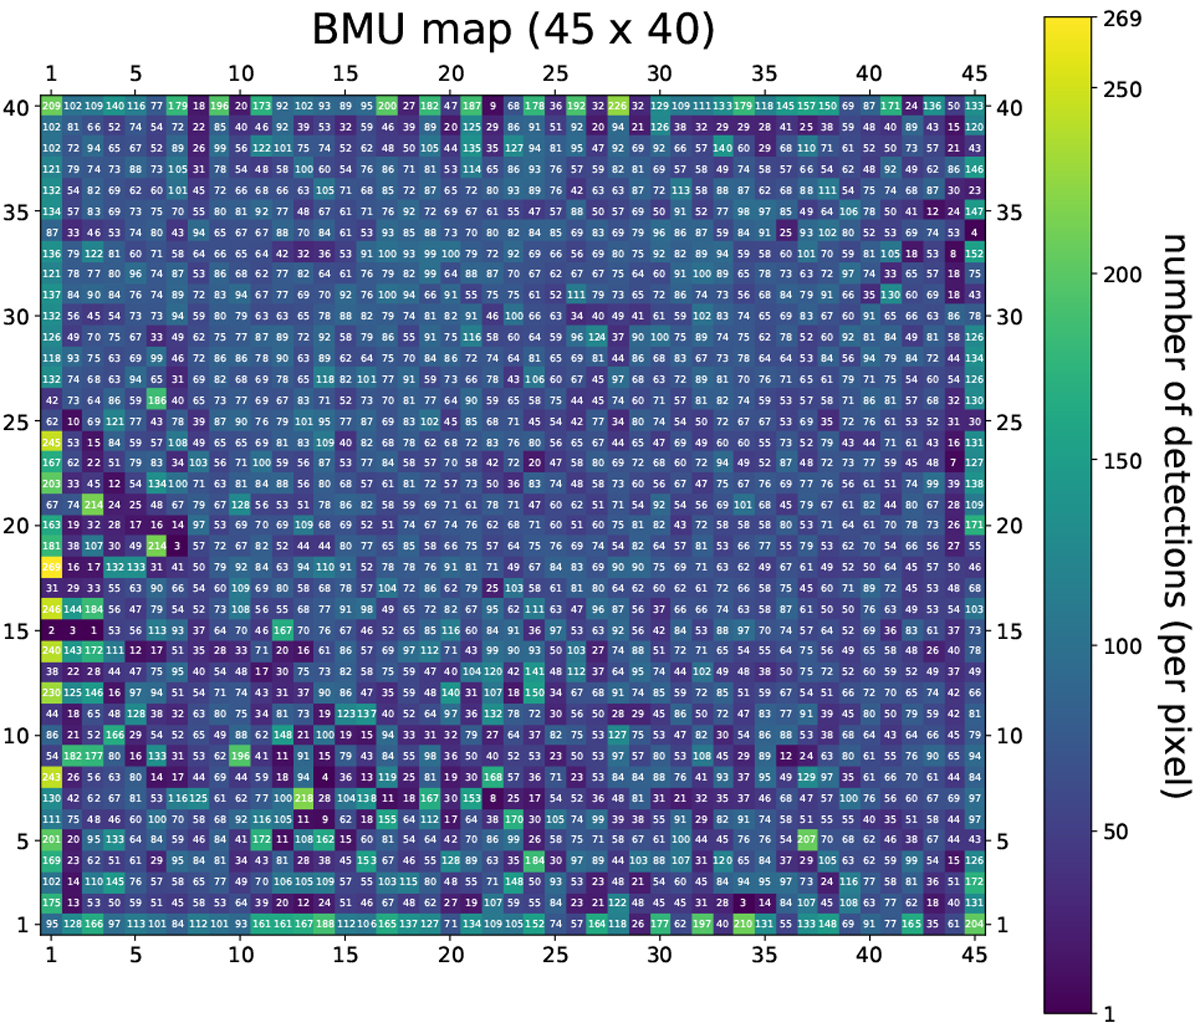
BMU map. This BMU map corresponds to all n = 128 925 detections. The color bar measures the number of detections placed on each pixel. This value is also indicated as a number on top of each pixel. The coordinates of the pixels within the grid start from the lower-left corner and are indicated onall sides of the map.
Current usage metrics show cumulative count of Article Views (full-text article views including HTML views, PDF and ePub downloads, according to the available data) and Abstracts Views on Vision4Press platform.
Data correspond to usage on the plateform after 2015. The current usage metrics is available 48-96 hours after online publication and is updated daily on week days.
Initial download of the metrics may take a while.