Fig. A.3
Download original image
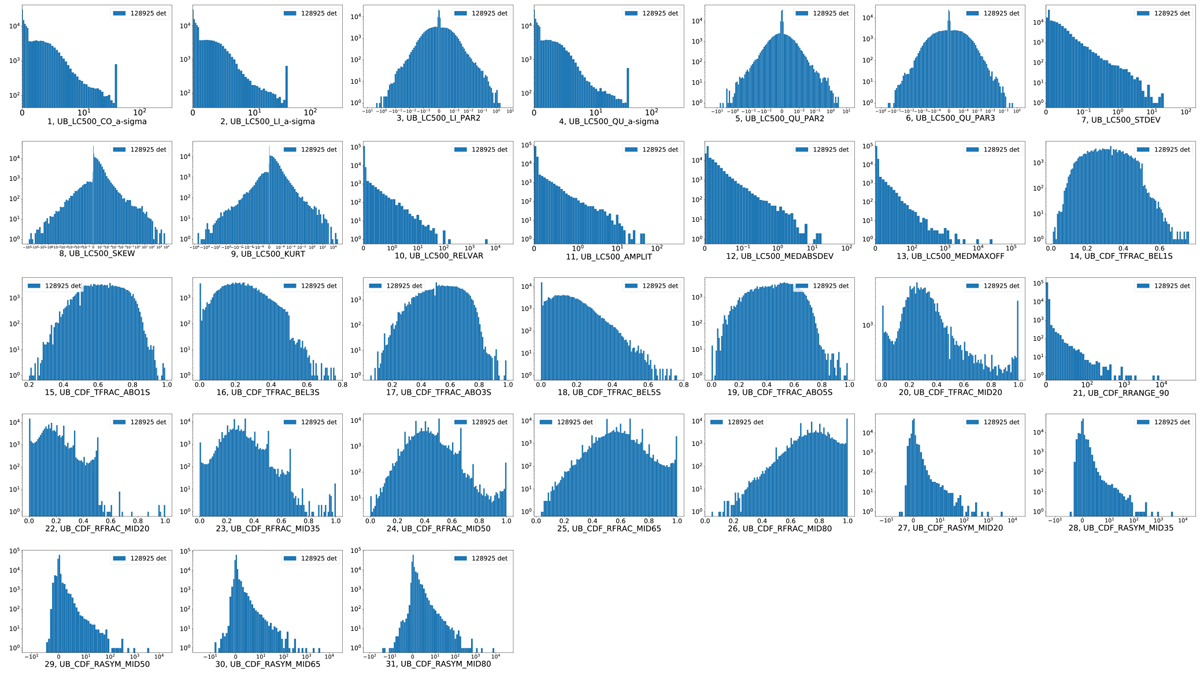
Histograms of the m = 31 parameter distributions. Each parameter is numbered corresponding to the order in Table A.1. The number of detections is the same for each parameter and is shown in the legend in every histogram. Histogram binning adaptively switches between linear (around zero) and logarithmic (in the distribution tails) in most cases to best present the distribution of each parameter. Number labels were omitted from ticks near zero for clarity. The vertical axes are in logarithmic scale.
Current usage metrics show cumulative count of Article Views (full-text article views including HTML views, PDF and ePub downloads, according to the available data) and Abstracts Views on Vision4Press platform.
Data correspond to usage on the plateform after 2015. The current usage metrics is available 48-96 hours after online publication and is updated daily on week days.
Initial download of the metrics may take a while.