Free Access
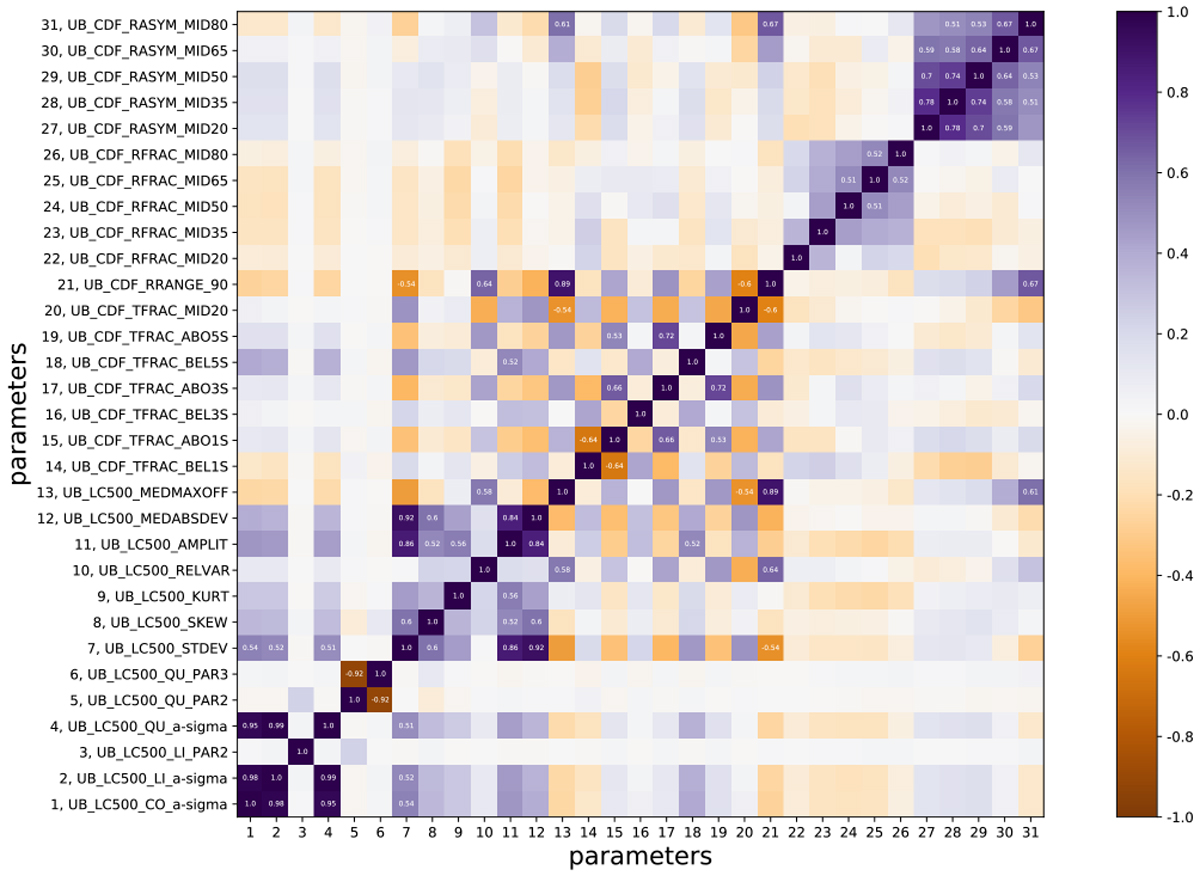
Fig. A.1
Download original image
Pearson r correlation matrix of all m = 31 normalized para- meter values. Positive (purple) values correspond to positive correlation while negative (brown) values to negative correlation. Correlation coefficients with absolute value less than 0.5 are not explicitly written.
Current usage metrics show cumulative count of Article Views (full-text article views including HTML views, PDF and ePub downloads, according to the available data) and Abstracts Views on Vision4Press platform.
Data correspond to usage on the plateform after 2015. The current usage metrics is available 48-96 hours after online publication and is updated daily on week days.
Initial download of the metrics may take a while.