Fig. 12
Download original image
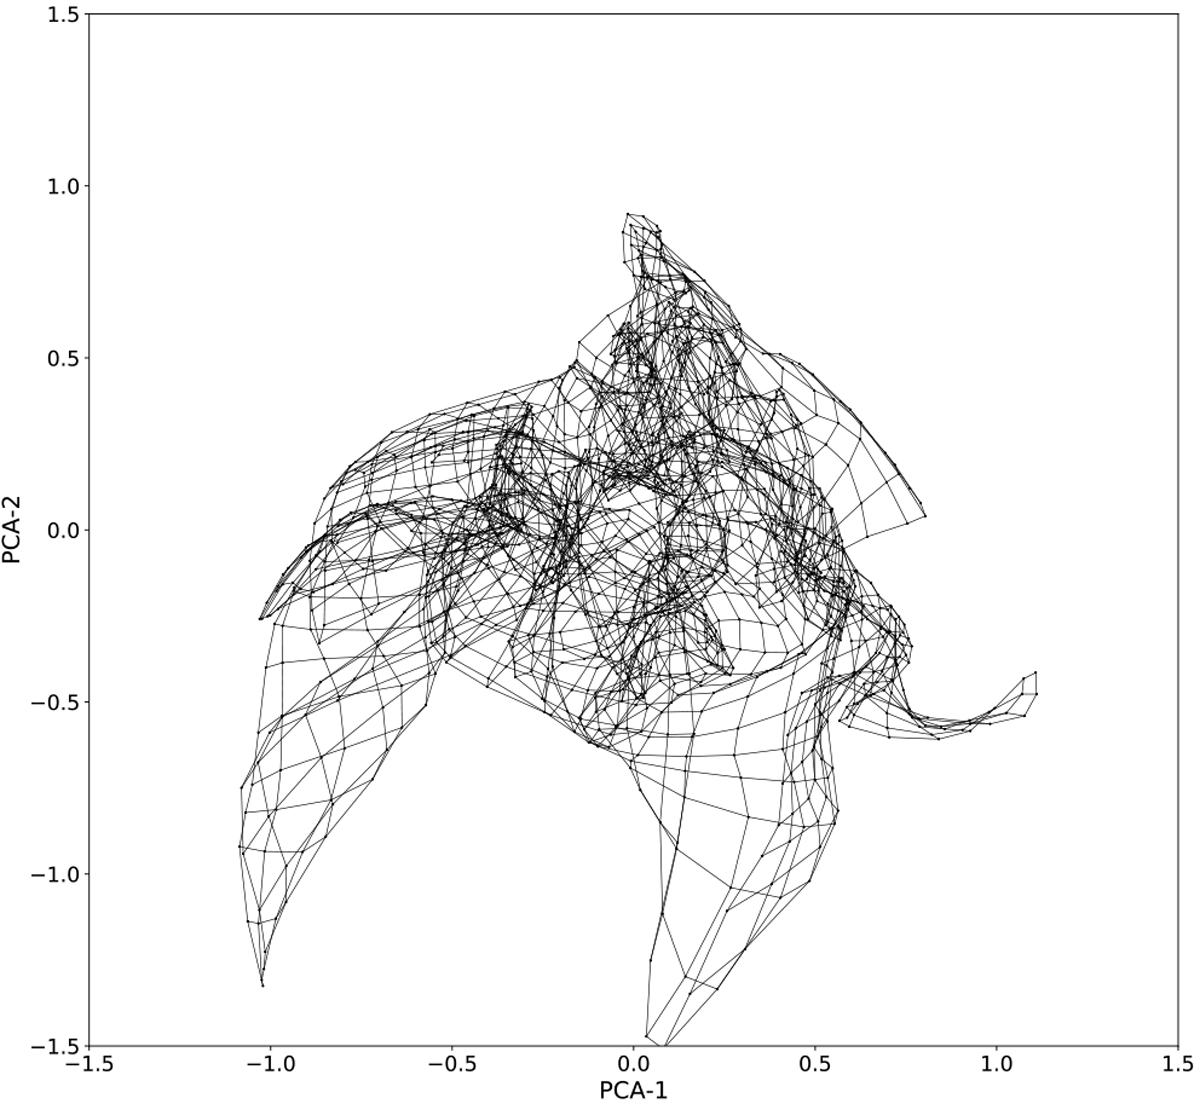
SOM map projected on a plane formed by the two largest PCA vectors. Dots represent SOM neurons while lines are connections between neighboring neurons. The evolution of the SOM map projection during training is available as an online movie ‘fig_s5_som_pca12_movie’. One can see how the map goes from its starting position as a rectangle, changes during rough training (1–80 epoch), and converges to its final position during fine training (81–160 epoch).
Current usage metrics show cumulative count of Article Views (full-text article views including HTML views, PDF and ePub downloads, according to the available data) and Abstracts Views on Vision4Press platform.
Data correspond to usage on the plateform after 2015. The current usage metrics is available 48-96 hours after online publication and is updated daily on week days.
Initial download of the metrics may take a while.