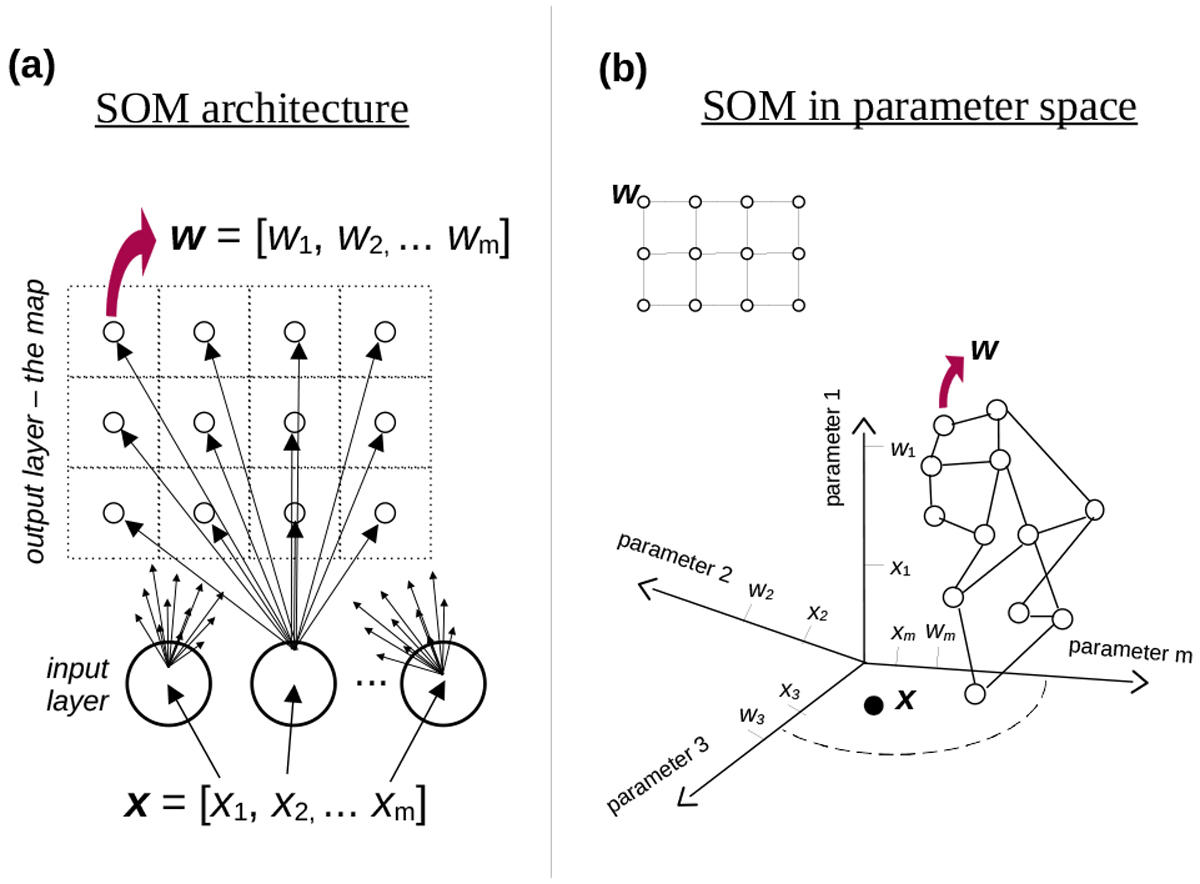
Fig. 1
Download original image
SOM schematics. Panel a: SOM architecture. The bottom circles represent input neurons while the upper smaller circles represent the output neurons which build up the flat 2D map. The input neurons receive the values of the object parameters and are connected to all the output neurons as indicated through arrows. The dashed squares centered on the output neurons are the pixels used to visualize the map. For the sake of clarity, only one input neuron shows arrows going all the way to each output neuron. Also weights w of only one output neuron are explicitly shown. Panel b: SOM in m-dimensional parameterspace. The position of the output neurons on the flat 2D map grid is visualized with lines connecting them. The same map is shown below, immersed in the input parameter space, where each axis represents one parameter. The coordinates of one neuron w and one object x are explicitly shown on the axes.
Current usage metrics show cumulative count of Article Views (full-text article views including HTML views, PDF and ePub downloads, according to the available data) and Abstracts Views on Vision4Press platform.
Data correspond to usage on the plateform after 2015. The current usage metrics is available 48-96 hours after online publication and is updated daily on week days.
Initial download of the metrics may take a while.