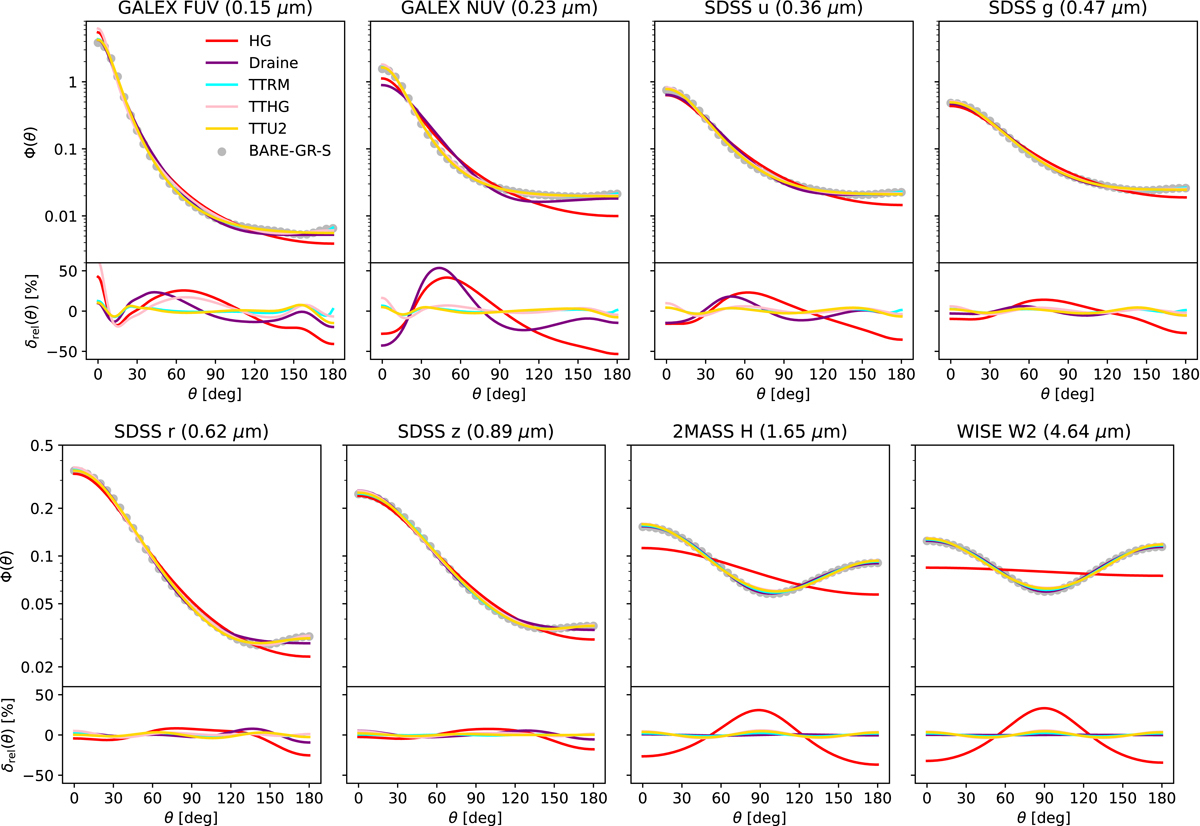
Fig. 1.
Download original image
Empirical scattering phase functions (grey dots) of the Zubko et al. (2004) BARE-GR-S dust model at the effective wavelengths of eight common UV–NIR bands. For the sake of clarity we only plotted the data points at a resolution of 5 deg, whereas the BARE-GR-S dataset contains phase function data at 1 deg resolution. The solid lines in each upper panel correspond to analytical phase function fits to these empirical data: the HG phase function (red, Sect. 3.1), the Draine phase function (purple, Sect. 3.2), the TTRM phase function (cyan, Sect. 3.4), and the new TTU2 phase function (gold, Sect. 4). Bottom panels: relative difference between the analytical model and the empirical data.
Current usage metrics show cumulative count of Article Views (full-text article views including HTML views, PDF and ePub downloads, according to the available data) and Abstracts Views on Vision4Press platform.
Data correspond to usage on the plateform after 2015. The current usage metrics is available 48-96 hours after online publication and is updated daily on week days.
Initial download of the metrics may take a while.