Fig. 3.
Download original image
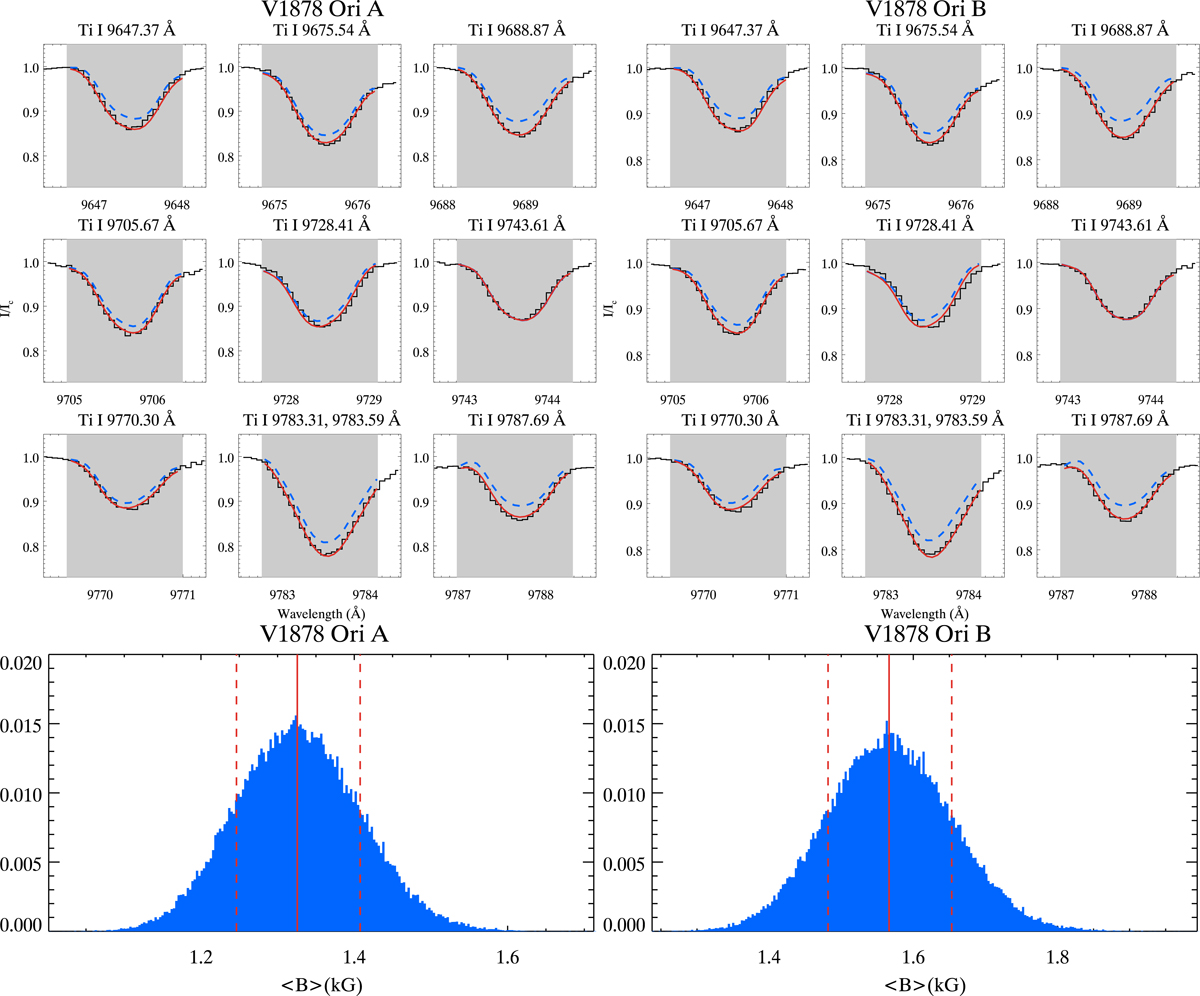
Inference result for V1878 Ori. Top: fit to the observed spectral lines (black histograms) with the spectra corresponding to the best-fitting parameters (solid red line). The dashed blue lines correspond to theoretical spectra without accounting for the magnetic field. Central wavelengths in Å of each line are given above the corresponding panels. Bottom: posterior distribution of the average surface magnetic field strength in the components of V1878 Ori. The vertical lines show the median (solid line) value and 68% percentile (dashed lines).
Current usage metrics show cumulative count of Article Views (full-text article views including HTML views, PDF and ePub downloads, according to the available data) and Abstracts Views on Vision4Press platform.
Data correspond to usage on the plateform after 2015. The current usage metrics is available 48-96 hours after online publication and is updated daily on week days.
Initial download of the metrics may take a while.