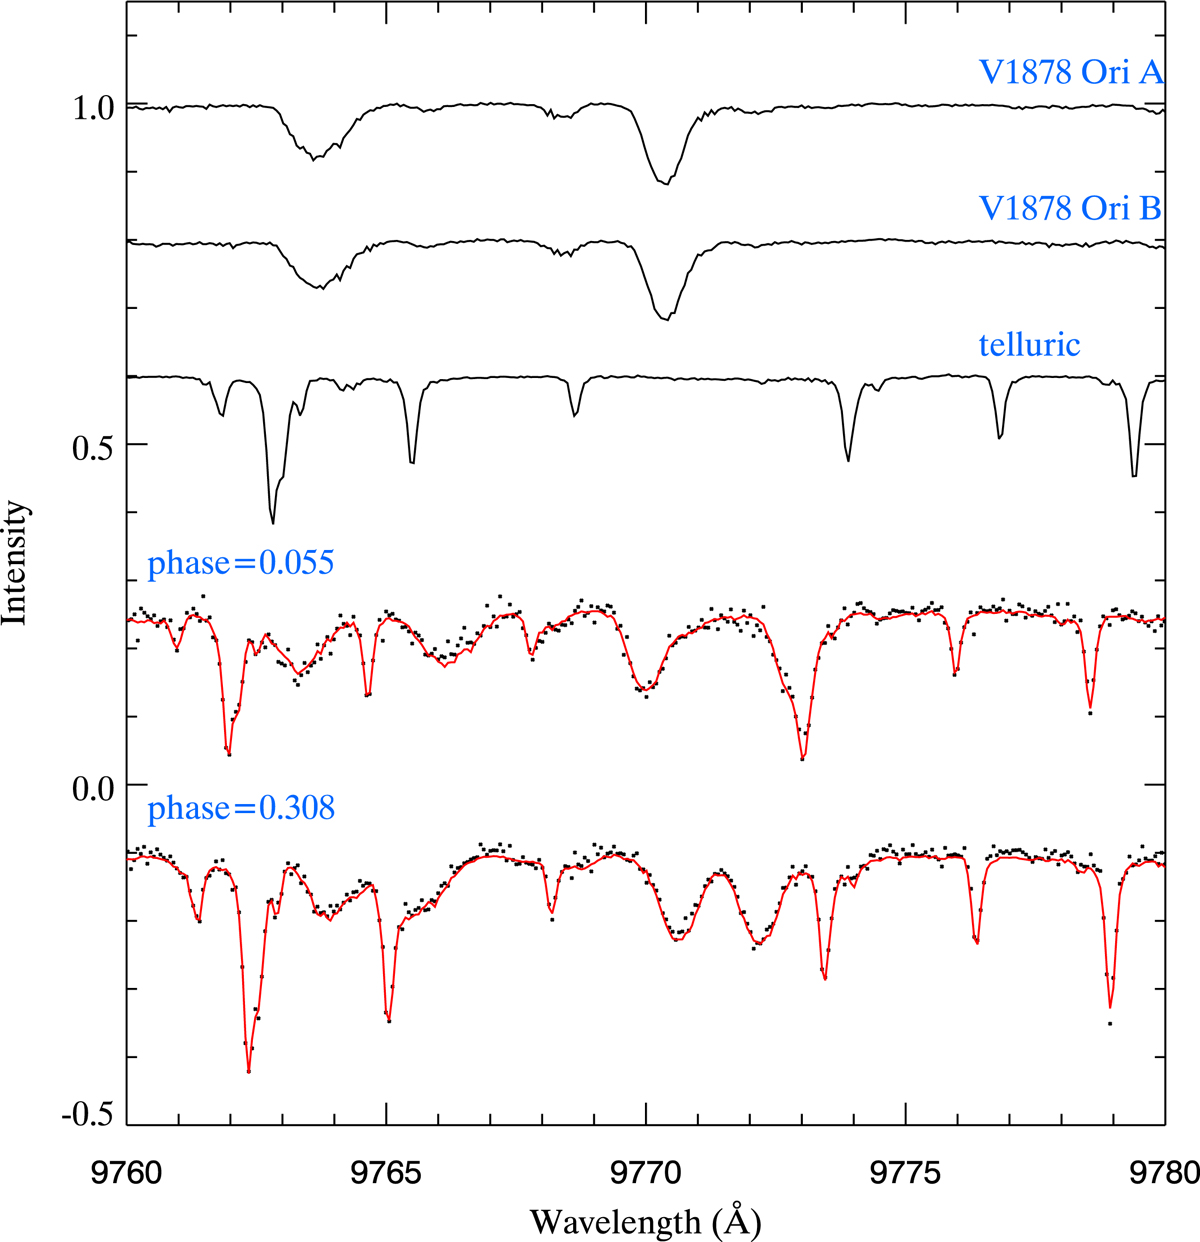
Fig. 1.
Download original image
Illustration of spectral disentangling results for V1878 Ori. The mean spectra of each component are shown at the top, followed by the derived telluric absorption (the third spectrum). The model composite spectra (solid lines) and observations (symbols) at the orbital phases close of the largest and smallest radial velocity separation of the components are compared below. The spectra are shifted vertically for visibility.
Current usage metrics show cumulative count of Article Views (full-text article views including HTML views, PDF and ePub downloads, according to the available data) and Abstracts Views on Vision4Press platform.
Data correspond to usage on the plateform after 2015. The current usage metrics is available 48-96 hours after online publication and is updated daily on week days.
Initial download of the metrics may take a while.