Fig. 7
Download original image
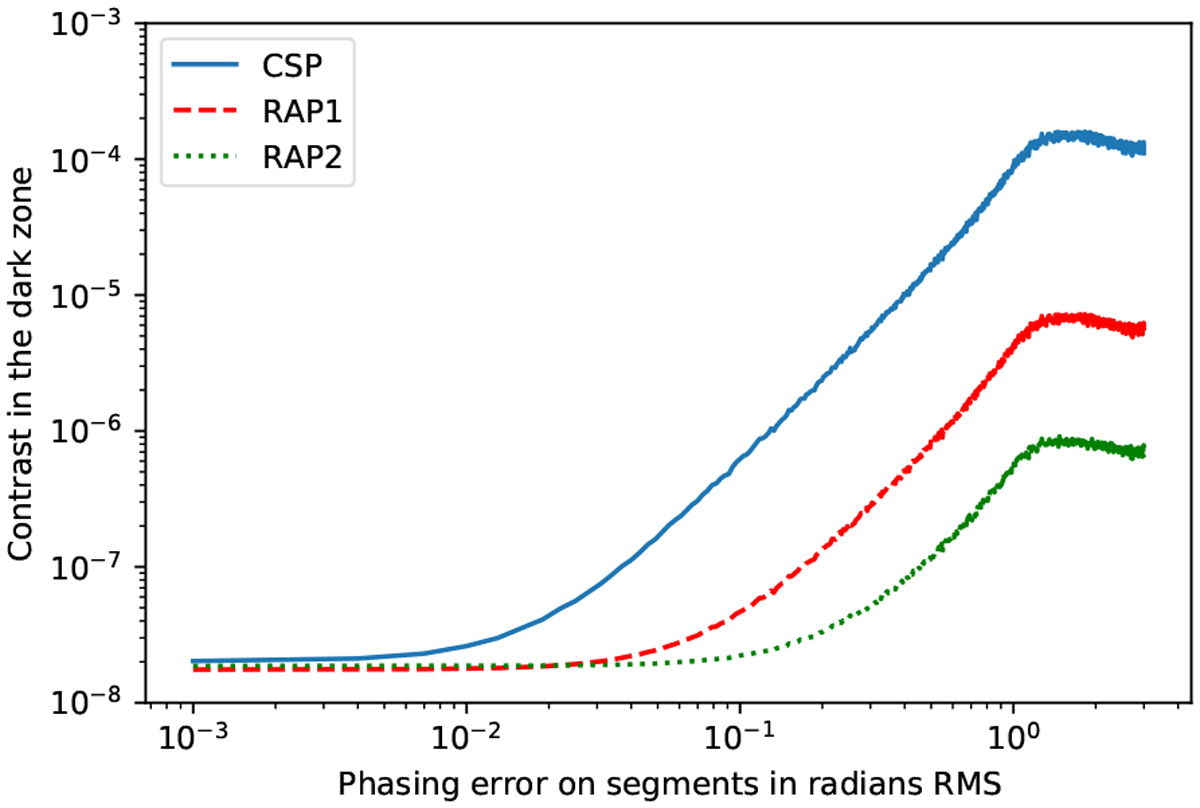
Evolution of the contrast with the phasing-error amplitude: (blue) for the CSP design, (red) for the RAP1 design, and (green) for the RAP2 design. 1000 different error amplitudes are considered between 1 mrad RMS and 3 rad RMS. For each of them, 100 phasing errors are simulated and propagated, 100 PSFs normalized by their aberrated direct-image peak are computed, and the average of the 100 resulting dark hole contrasts is plotted.
Current usage metrics show cumulative count of Article Views (full-text article views including HTML views, PDF and ePub downloads, according to the available data) and Abstracts Views on Vision4Press platform.
Data correspond to usage on the plateform after 2015. The current usage metrics is available 48-96 hours after online publication and is updated daily on week days.
Initial download of the metrics may take a while.