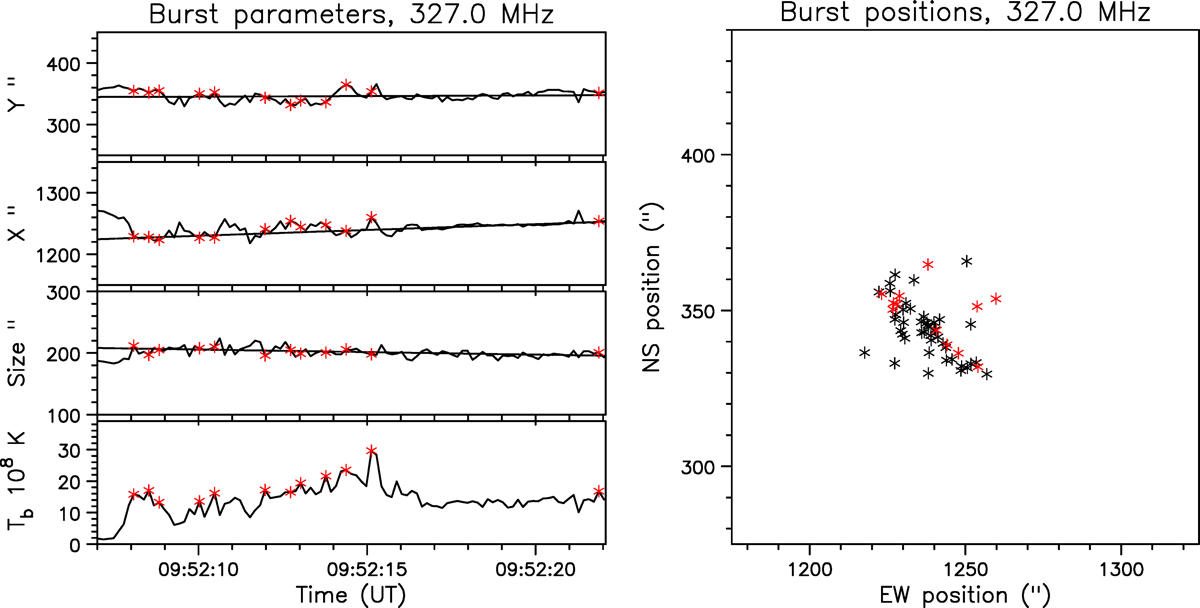
Fig. 8.
Download original image
Brightness temperature, size, and position of sources as a function of time at 327.0 MHz (left). Size is the geometric average of the axes of the fitted ellipse. Straight lines are the result of linear regression. Positions of the sources on the plane of the sky after 09:52:08 UT (right). Spike sources are marked as red asterisks in both plots.
Current usage metrics show cumulative count of Article Views (full-text article views including HTML views, PDF and ePub downloads, according to the available data) and Abstracts Views on Vision4Press platform.
Data correspond to usage on the plateform after 2015. The current usage metrics is available 48-96 hours after online publication and is updated daily on week days.
Initial download of the metrics may take a while.