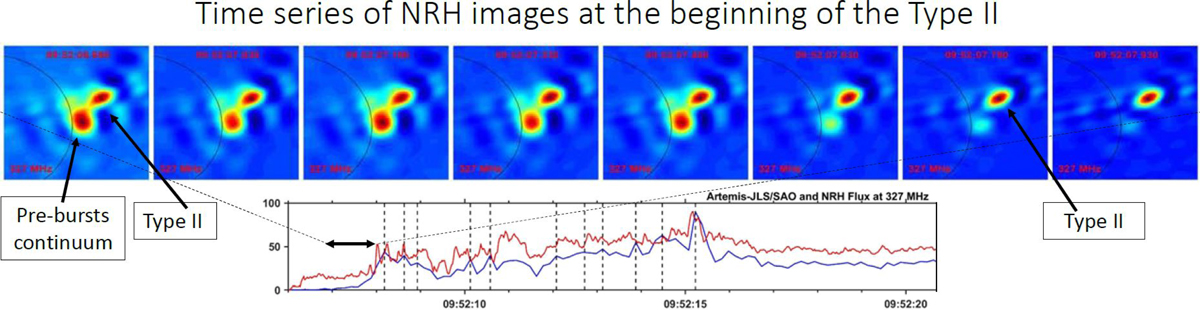
Fig. 6.
Download original image
NRH & SAO images at the beginning of the type II emission at 327.0 MHz. Top: sequence of NRH 2D images near the start of the type II at 327 Mz. The color table of each image is normalized to the corresponding minimum and maximum intensity. The black arch marks the photosheric limb. Bottom: flux as a function of time for NRH (blue) and for SAO (red). The time range of the images is marked by the double arrow.
Current usage metrics show cumulative count of Article Views (full-text article views including HTML views, PDF and ePub downloads, according to the available data) and Abstracts Views on Vision4Press platform.
Data correspond to usage on the plateform after 2015. The current usage metrics is available 48-96 hours after online publication and is updated daily on week days.
Initial download of the metrics may take a while.