Fig. 3.
Download original image
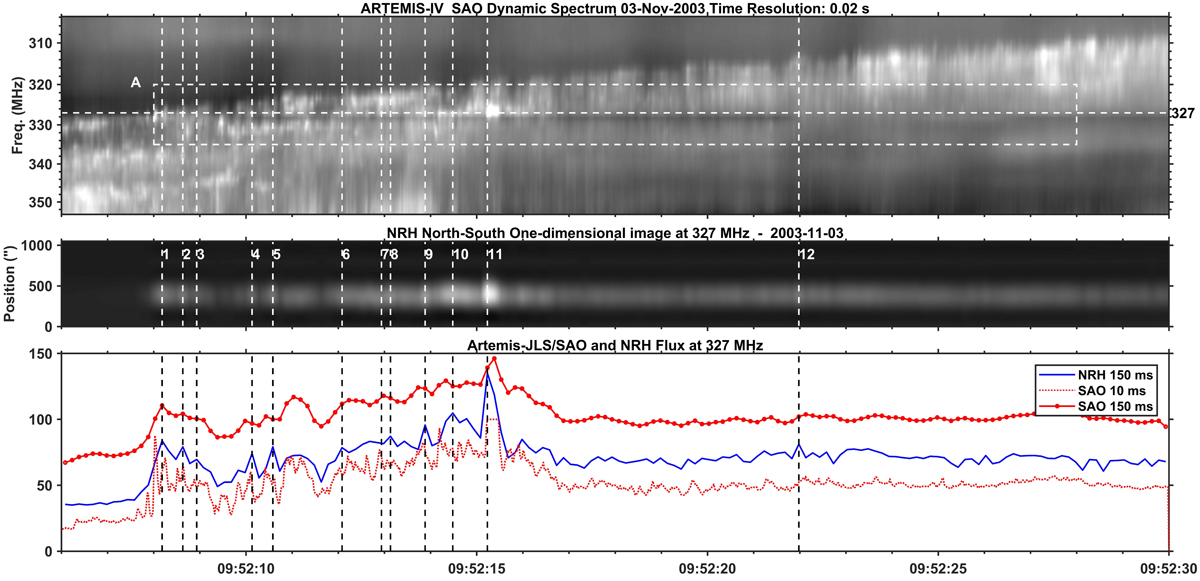
Spike chain A recordings from SAO and NRH. Upper panel: SAO dynamic spectrum for spike chain A (box in Fig. 2). The corresponding frequency of the NRH is marked on the right. Next panel: the NS 1D NRH images at 327 MHz. Last panel: we show NRH (blue) and SAO (red) normalized total flux time profiles at 327 MHz and at 150 ms resolution are presented; a second SAO high-resolution (10 ms) profile (red dotted) is included for comparison. Twelve spike-like structures, numbered (1–12), are marked by vertical dashed lines.
Current usage metrics show cumulative count of Article Views (full-text article views including HTML views, PDF and ePub downloads, according to the available data) and Abstracts Views on Vision4Press platform.
Data correspond to usage on the plateform after 2015. The current usage metrics is available 48-96 hours after online publication and is updated daily on week days.
Initial download of the metrics may take a while.