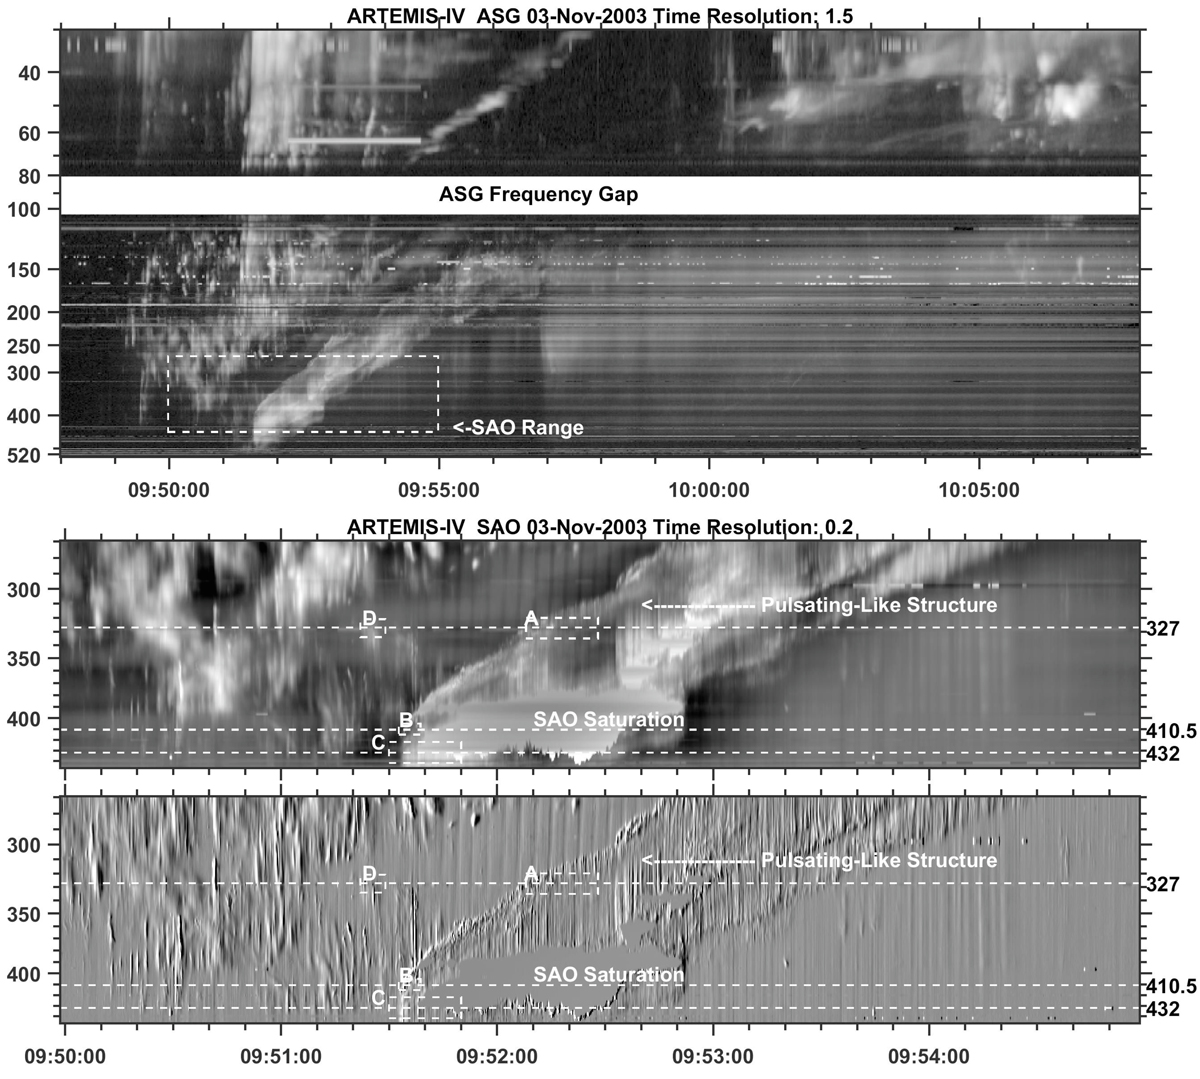
Fig. 2.
Download original image
Event SOL2003-11-03T09:43:20 recorded by the ARTEMIS-JLS/ASG and ARTEMIS-JLS/SAO receivers. The Dynamic spectrum of the entire event from ARTEMIS-JLS/ASG is presented in the upper panel. Middle panel: we show the SAO dynamic spectrum and in the lower panel, its time derivative inside the 5 min box of the upper panel. The dashed white horizontal lines on the spectrum mark three of the frequencies (327, 410.5, and 432 MHz) of the Nançay radioheliograph (NRH) channels. The boxes indicate selected segments of spike chains, (A, B, C & D) which are studied in this work (shown enlarged in Figs. 3–5).
Current usage metrics show cumulative count of Article Views (full-text article views including HTML views, PDF and ePub downloads, according to the available data) and Abstracts Views on Vision4Press platform.
Data correspond to usage on the plateform after 2015. The current usage metrics is available 48-96 hours after online publication and is updated daily on week days.
Initial download of the metrics may take a while.