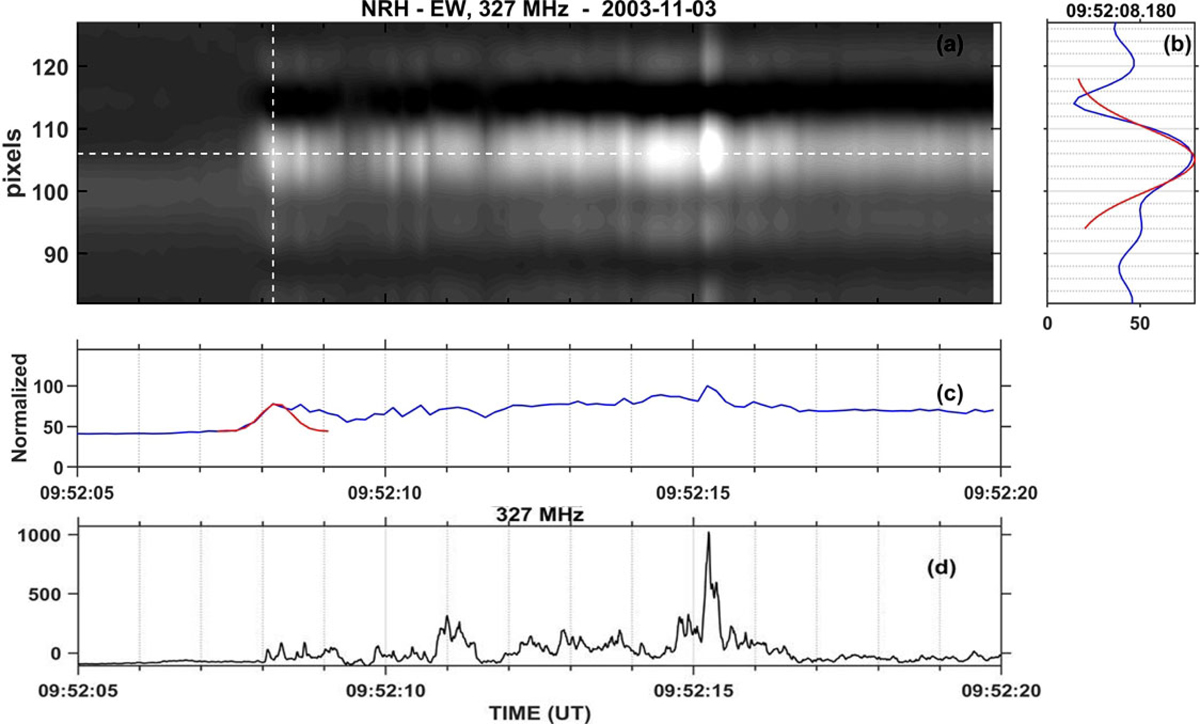
Fig. 1.
Download original image
Measurement of the duration and size of an individual spike in the NRH 1D recording. Panel b: NRH total normalized flux in the east-west direction and panel c: the temporal profile at 327 MHz. Panel d: we present the Artemis-JLS/SAO time profile at 327 MHz for comparison. The red curves in panels b and c trace the Gaussian fit used in the duration and width measurement of the spikes. The bright bands above and below the main one are due to sidelobes.
Current usage metrics show cumulative count of Article Views (full-text article views including HTML views, PDF and ePub downloads, according to the available data) and Abstracts Views on Vision4Press platform.
Data correspond to usage on the plateform after 2015. The current usage metrics is available 48-96 hours after online publication and is updated daily on week days.
Initial download of the metrics may take a while.