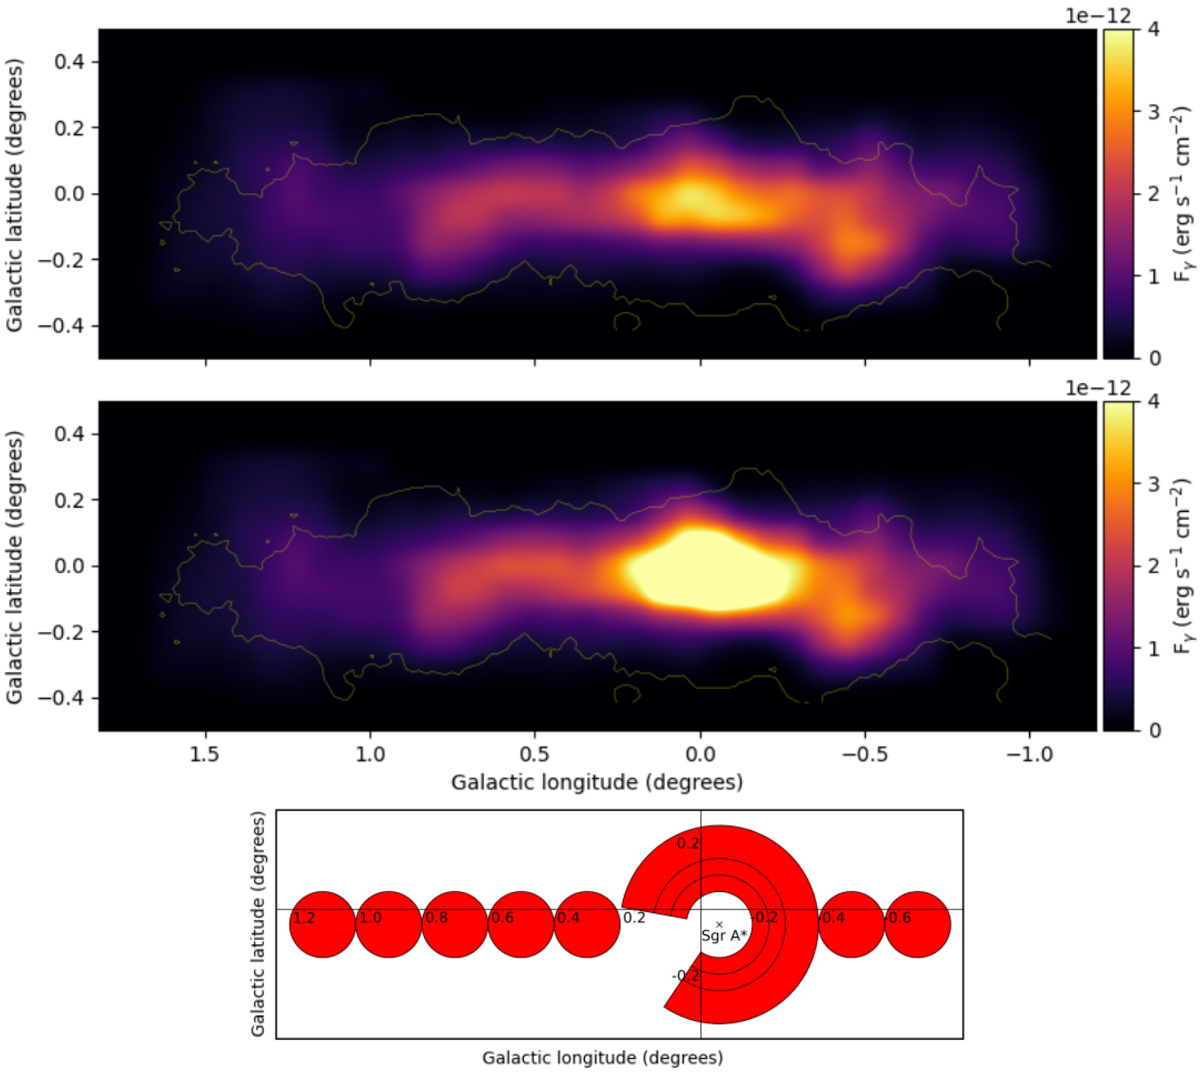
Fig. 2
Download original image
Synthetic maps of Gamma-ray flux and analysis areas. Top and middle panels: gamma-ray flux synthetic maps as observed from Earth for the CMZ ring model (top) and disk model (middle) models. Both maps have been smoothed with a 0.08° Gaussian function to adopt the HESS beamwidth. The yellow contour compares the observed gamma-ray area published in the HESS Galactic plane survey (H.E.S.S. Collaboration 2018), with the synthetic maps’ extension. The contour level is 1 × 10⁻¹³ erg cm−2 s−1. Bottom panel: regions where we compare our models with the H.E.S.S. Collaboration (2016) observations in Figs. 3 and 4, shown at the same scale.
Current usage metrics show cumulative count of Article Views (full-text article views including HTML views, PDF and ePub downloads, according to the available data) and Abstracts Views on Vision4Press platform.
Data correspond to usage on the plateform after 2015. The current usage metrics is available 48-96 hours after online publication and is updated daily on week days.
Initial download of the metrics may take a while.