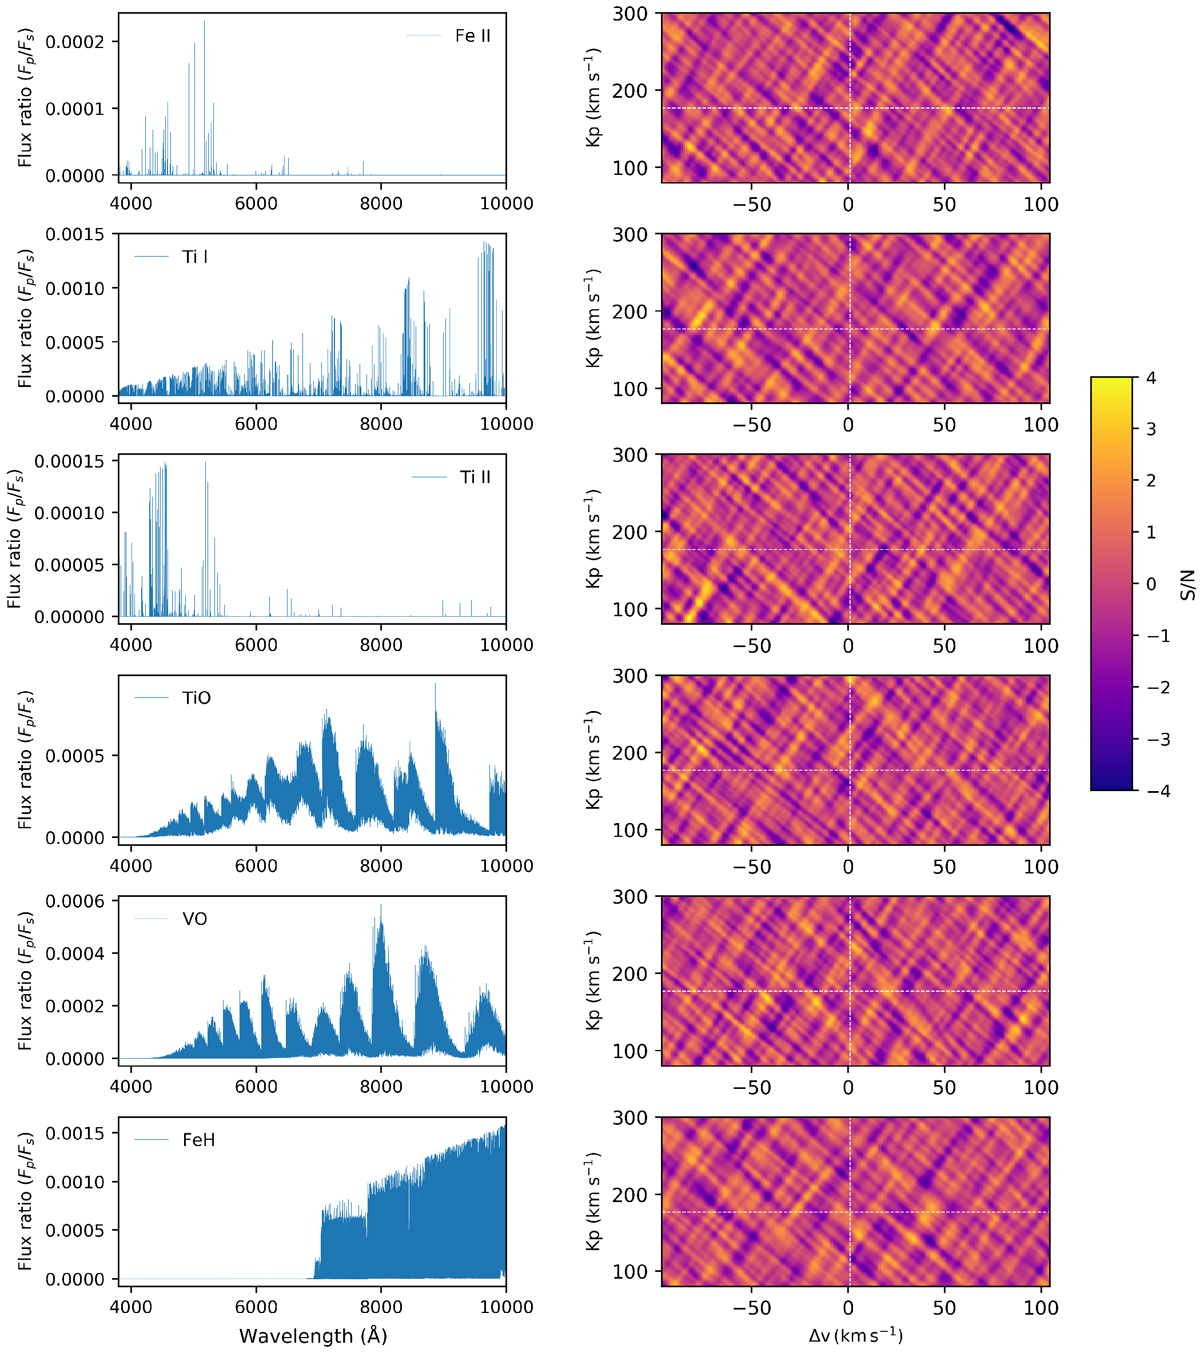
Fig. A.1
Download original image
Nondetection of several other chemical species. Left panels: Spectral model of each species. These are normalized spectra that are calculated in a similar way as described in Section 3.1.1. Right panels: Combined two-night Kp -Δv map of each species. The dashed white lines indicate the location of the best-fit Kp –Δv from the Fe I signal.
Current usage metrics show cumulative count of Article Views (full-text article views including HTML views, PDF and ePub downloads, according to the available data) and Abstracts Views on Vision4Press platform.
Data correspond to usage on the plateform after 2015. The current usage metrics is available 48-96 hours after online publication and is updated daily on week days.
Initial download of the metrics may take a while.