Fig. 7
Download original image
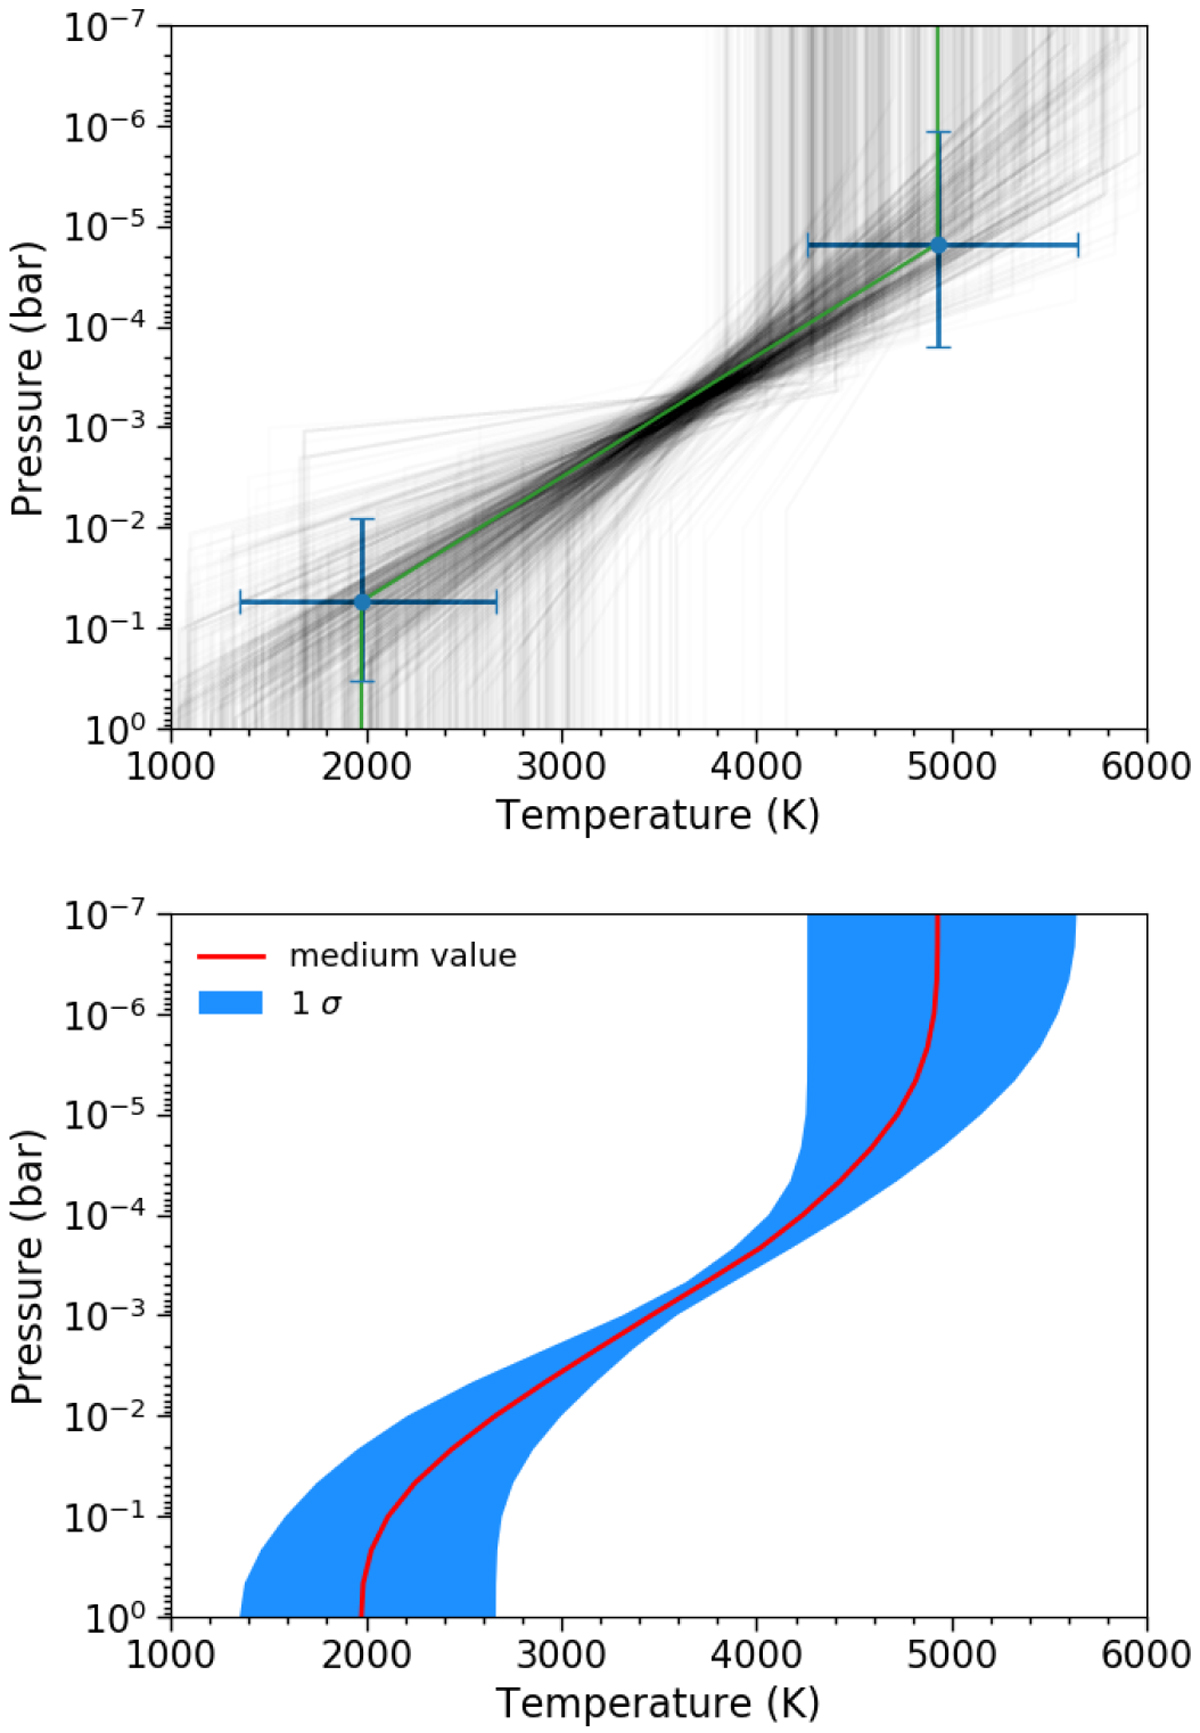
Retrieved T–P profile from the CARMENES data. Upper panel: retrieved results of the two-point T–P model. The blue points with error bars are the best-fit (T1, P1) and (T2, P2) values. The gray lines show examples of the T–P profiles sampled by the MCMC analysis. Lower panel: median of the sampled T–P profiles (red line) and the 1σ envelope (blue shadow). They are generated by sorting the temperatures of the MCMC samples at each of the 25 atmosphere layers.
Current usage metrics show cumulative count of Article Views (full-text article views including HTML views, PDF and ePub downloads, according to the available data) and Abstracts Views on Vision4Press platform.
Data correspond to usage on the plateform after 2015. The current usage metrics is available 48-96 hours after online publication and is updated daily on week days.
Initial download of the metrics may take a while.