Fig. 5
Download original image
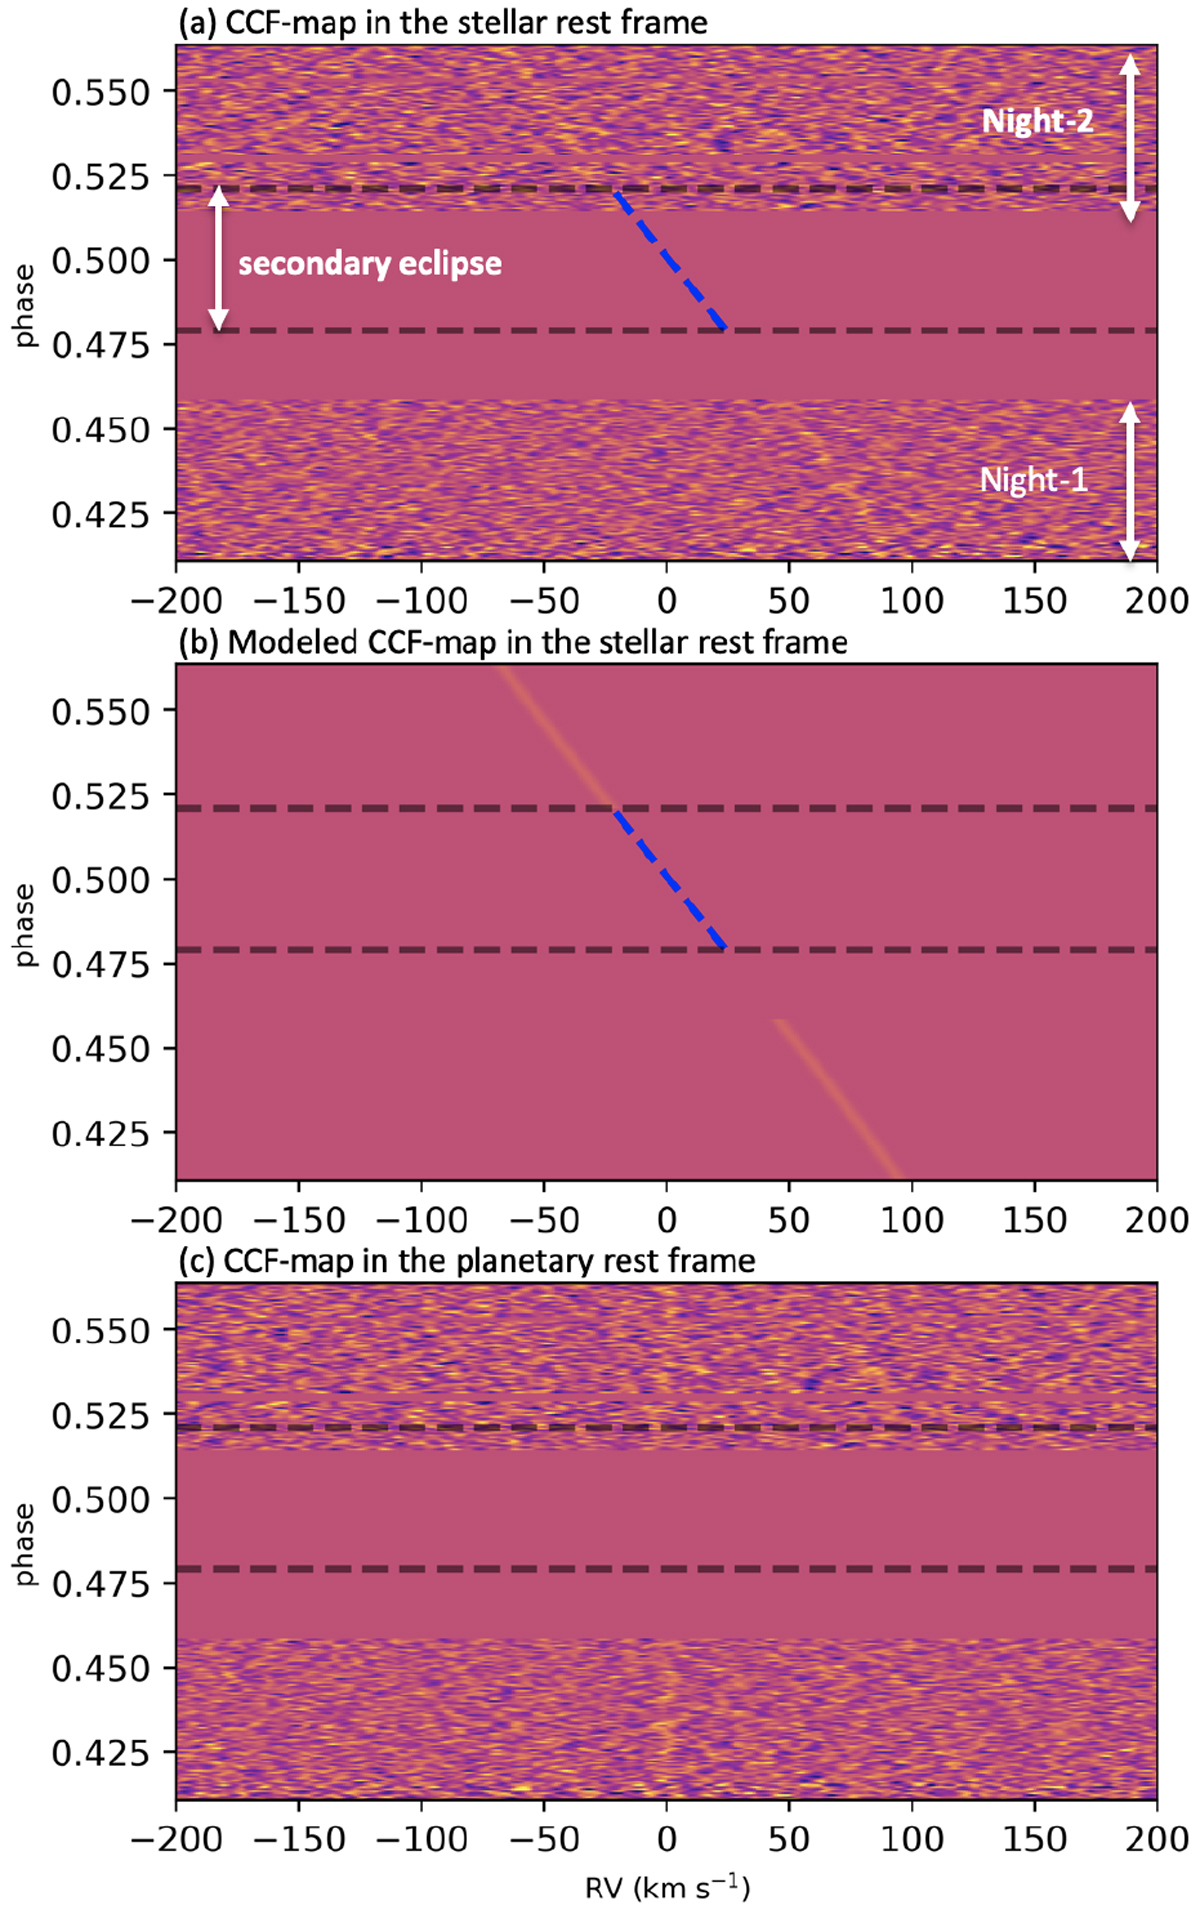
Cross-correlation functions of the spectra from the two nights. Upper panel: CCF map in the stellar rest frame. Middle panel: modeled CCF map with the best-fit Kp and Δ v values. Lower panel: CCF map in the planetary rest frame. The horizontal dashed lines indicate the beginning and end of the eclipse. The dashed blue line denotes the planetary orbital motion RV.
Current usage metrics show cumulative count of Article Views (full-text article views including HTML views, PDF and ePub downloads, according to the available data) and Abstracts Views on Vision4Press platform.
Data correspond to usage on the plateform after 2015. The current usage metrics is available 48-96 hours after online publication and is updated daily on week days.
Initial download of the metrics may take a while.