Fig. 3
Download original image
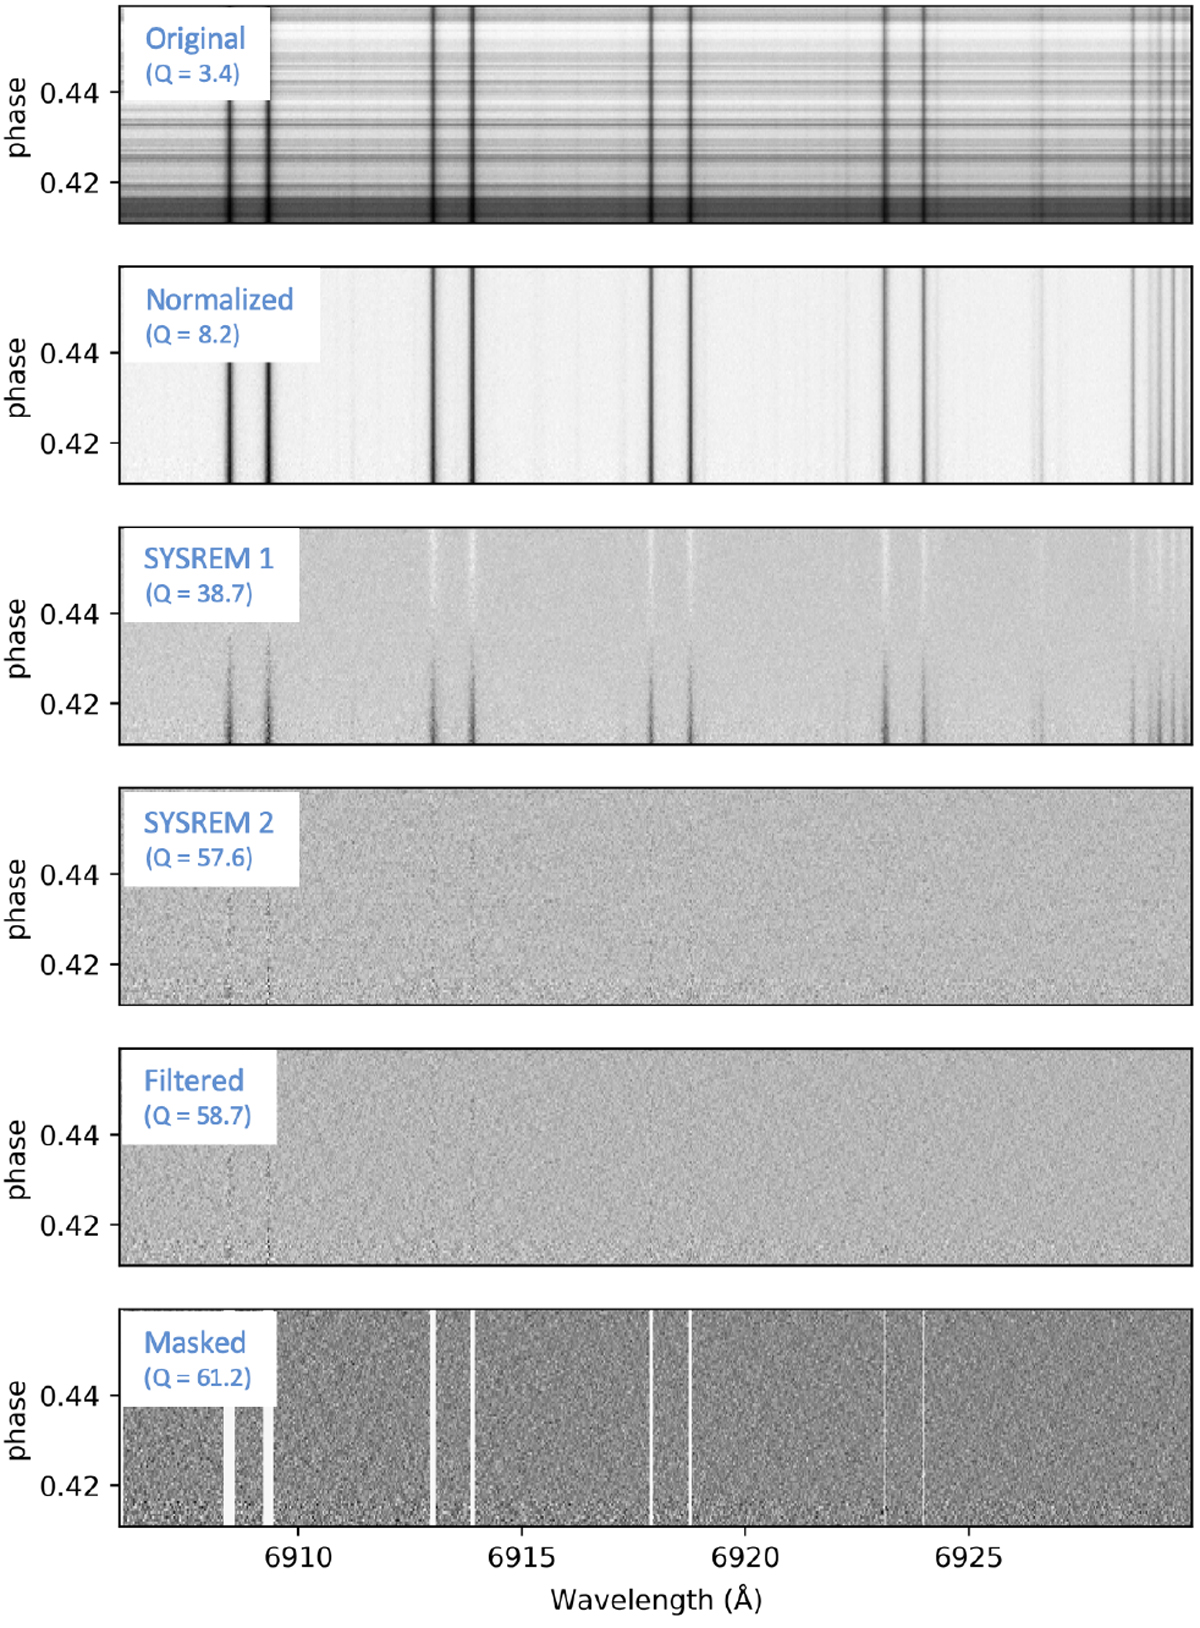
Example of the data reduction procedure. These are the spectra from the first observation night, which are presented in a small wavelength range for demonstration purposes. The spectral matrices from top to bottom are original spectra, normalized spectra, spectra after the first SYSREM, spectra after the second SYSREM, spectra after the Gaussian high-pass filtering, and spectra after the masking. To estimate the efficiency of each data reduction procedure, we computed a metric Q, which is defined as the ratio of the mean value and the standard deviation of each spectral matrix.
Current usage metrics show cumulative count of Article Views (full-text article views including HTML views, PDF and ePub downloads, according to the available data) and Abstracts Views on Vision4Press platform.
Data correspond to usage on the plateform after 2015. The current usage metrics is available 48-96 hours after online publication and is updated daily on week days.
Initial download of the metrics may take a while.