Open Access
Fig. 9.
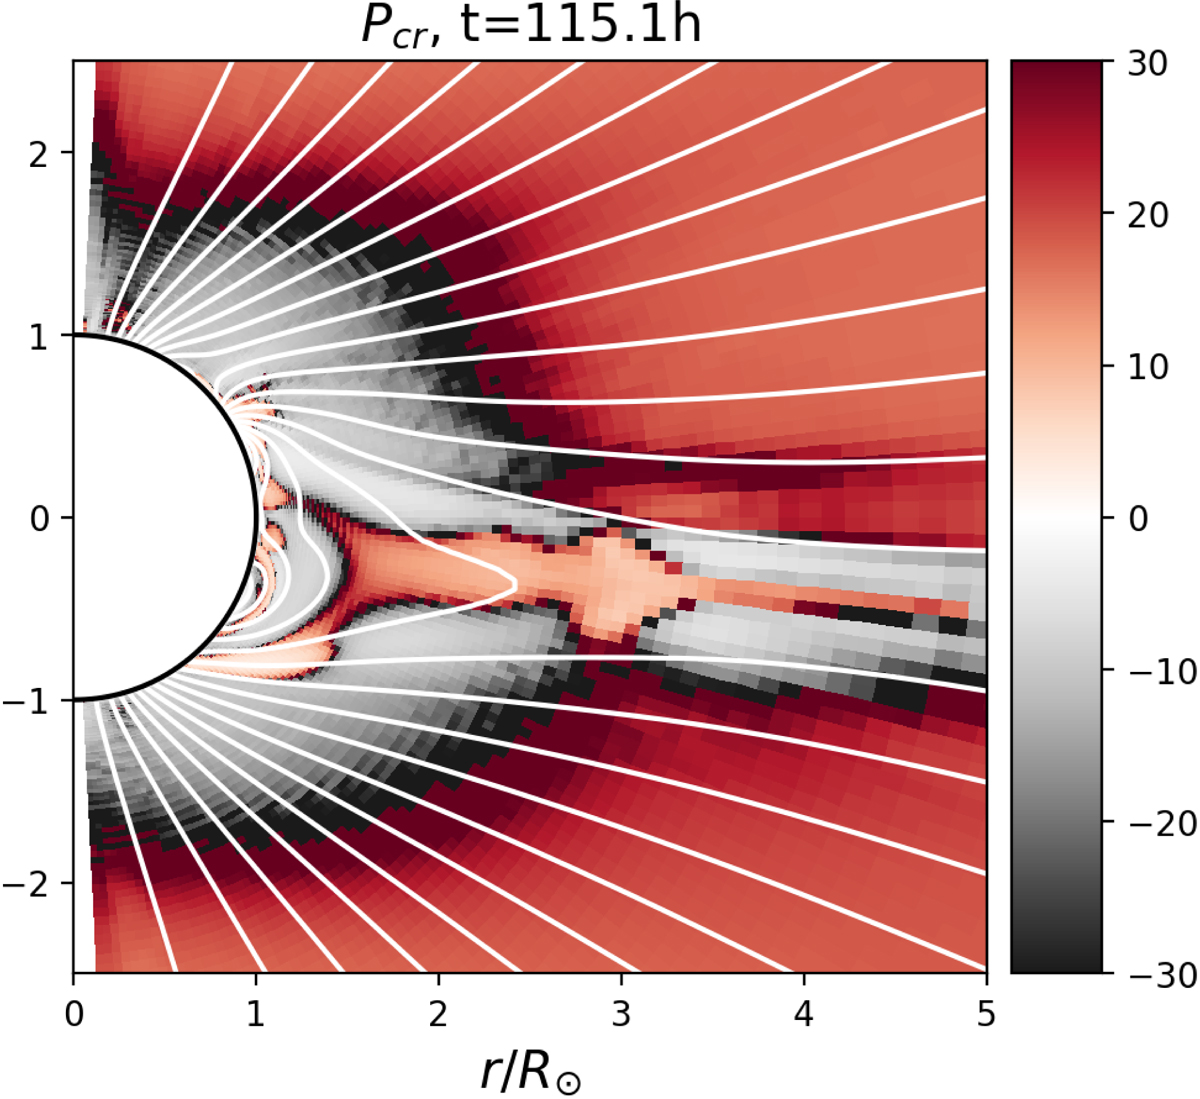
Download original image
Period of the pressure driven instability in the close corona. The panel shows a meridional cut at ϕ = π (180° longitude) for the June 14 simulation. Grey regions mark stable zones. In the inner corona, we clearly identify the tip of helmet streamers and the HCS as unstable zones, with a typical value of Pcr ∼ 10 − 30 h.
Current usage metrics show cumulative count of Article Views (full-text article views including HTML views, PDF and ePub downloads, according to the available data) and Abstracts Views on Vision4Press platform.
Data correspond to usage on the plateform after 2015. The current usage metrics is available 48-96 hours after online publication and is updated daily on week days.
Initial download of the metrics may take a while.