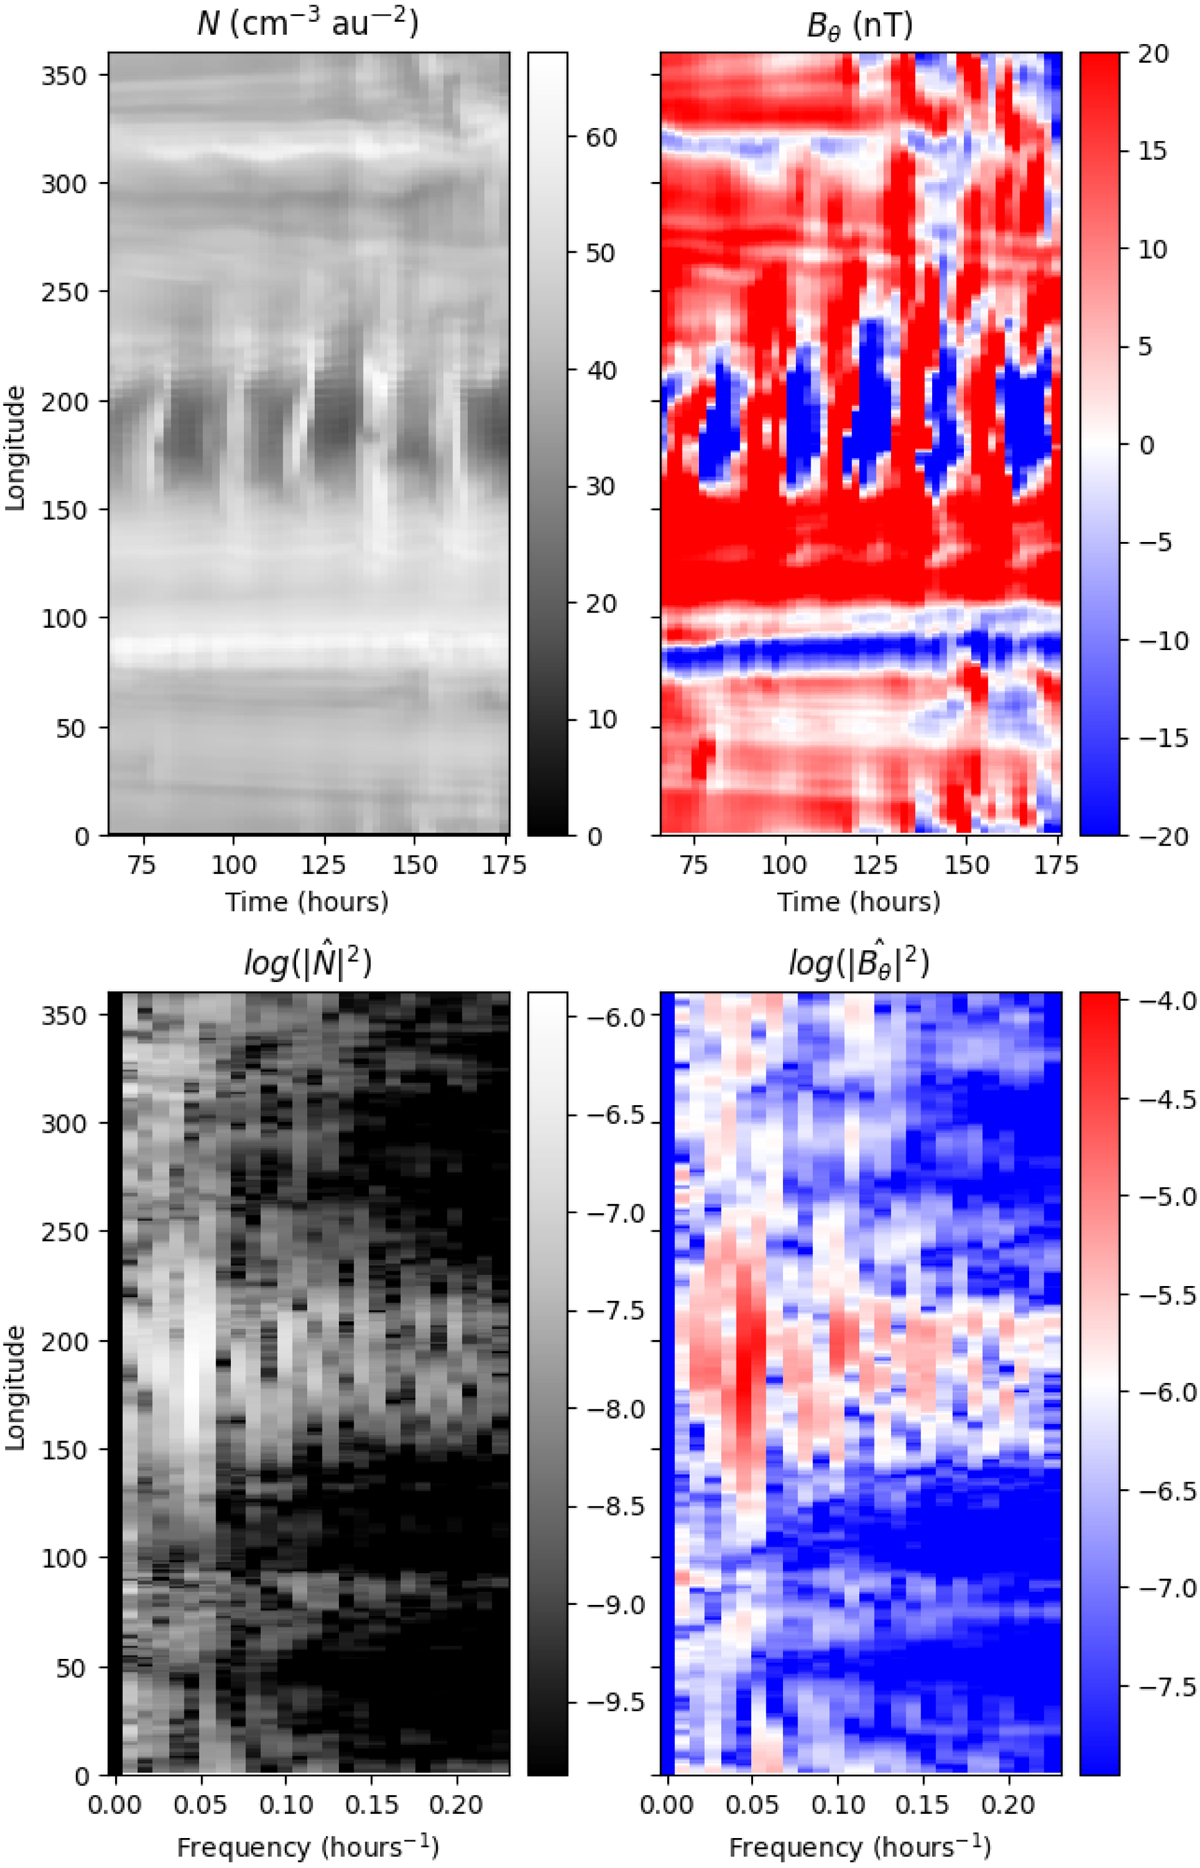
Fig. 8.
Download original image
Variability of the HCS at 15 R⊙ for the June 14 simulation. In the top panel, the number density, N, and the latitudinal magnetic field, Bθ, are extracted along the HCS and stacked over time. Several propagating flux ropes are going through the domain, with various longitudinal extents, but a rather steady time pattern. In the bottom panel, we show a Fourier analysis over time (for each longitude). For all quantities, the peak is located around a period of 20 h.
Current usage metrics show cumulative count of Article Views (full-text article views including HTML views, PDF and ePub downloads, according to the available data) and Abstracts Views on Vision4Press platform.
Data correspond to usage on the plateform after 2015. The current usage metrics is available 48-96 hours after online publication and is updated daily on week days.
Initial download of the metrics may take a while.