Fig. 6.
Download original image
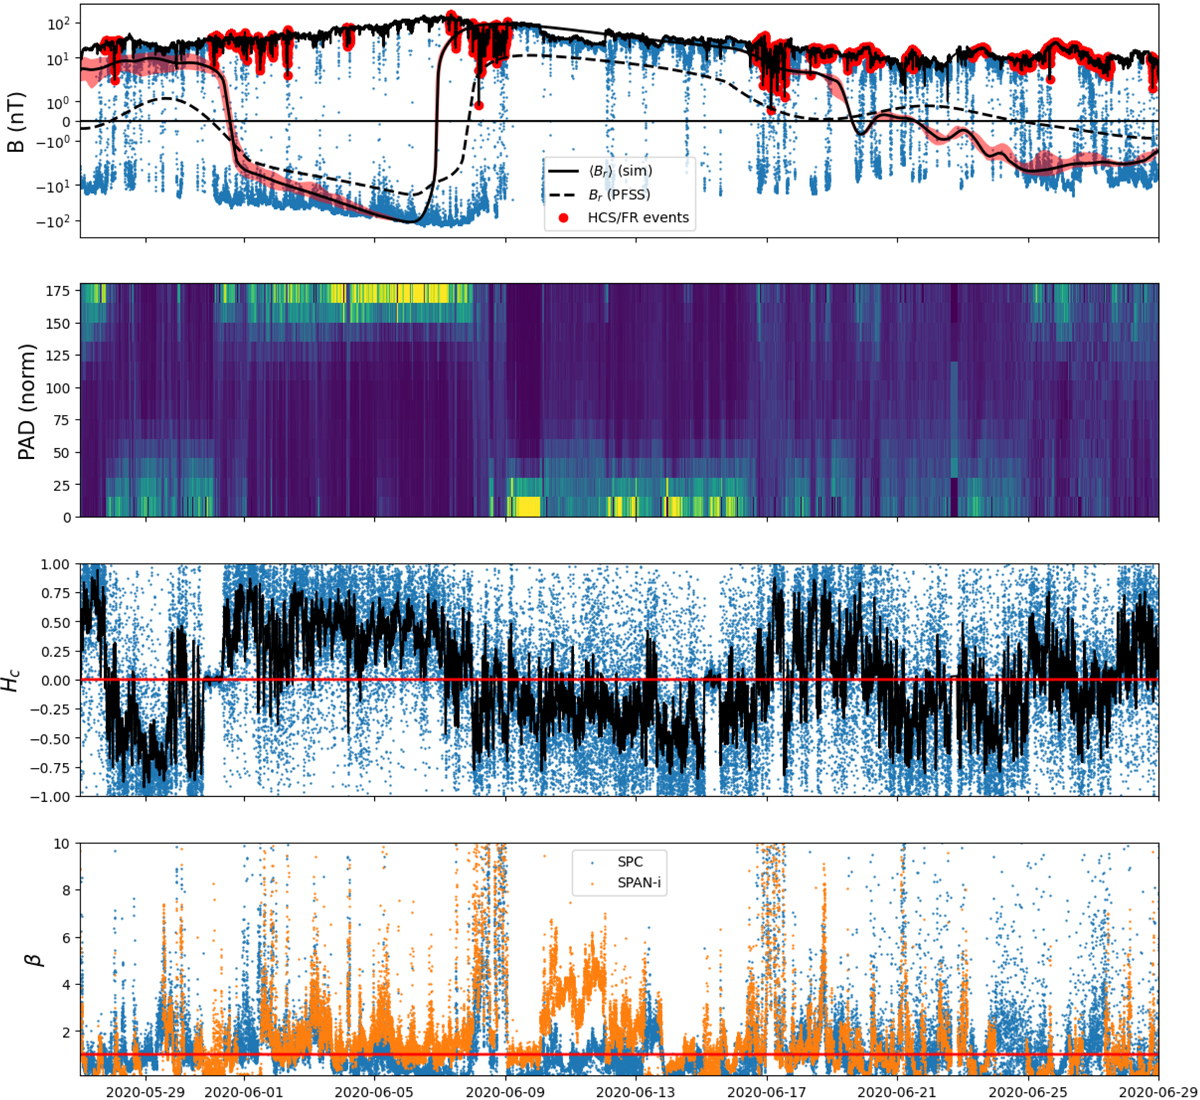
PSP measurements of dynamical structures. In the first panel, we show the observed radial (blue) and total (black) magnetic field over the month of June. The results of the simulation and of the PFSS models are repeated from Fig. 2, and the variability of the simulations is shown in shaded red. Red points identify flux rope events and partial or total HCS crossings observed in the data on the total magnetic field line. They are further identified with the second panel, showing the normalized pitch-angle distribution of electrons in the eight channel of SPAN-e, around 300 eV. The third panel shows the cross-helicity of perturbations in the velocity and magnetic field, and is close to one in negative polarity, close to minus one in positive polarity of the interplanetary magnetic field. The bottom panel shows the value of the plasma beta parameter obtained with SPC and SPAN-i, and the red line indicates a value of β = 1.
Current usage metrics show cumulative count of Article Views (full-text article views including HTML views, PDF and ePub downloads, according to the available data) and Abstracts Views on Vision4Press platform.
Data correspond to usage on the plateform after 2015. The current usage metrics is available 48-96 hours after online publication and is updated daily on week days.
Initial download of the metrics may take a while.