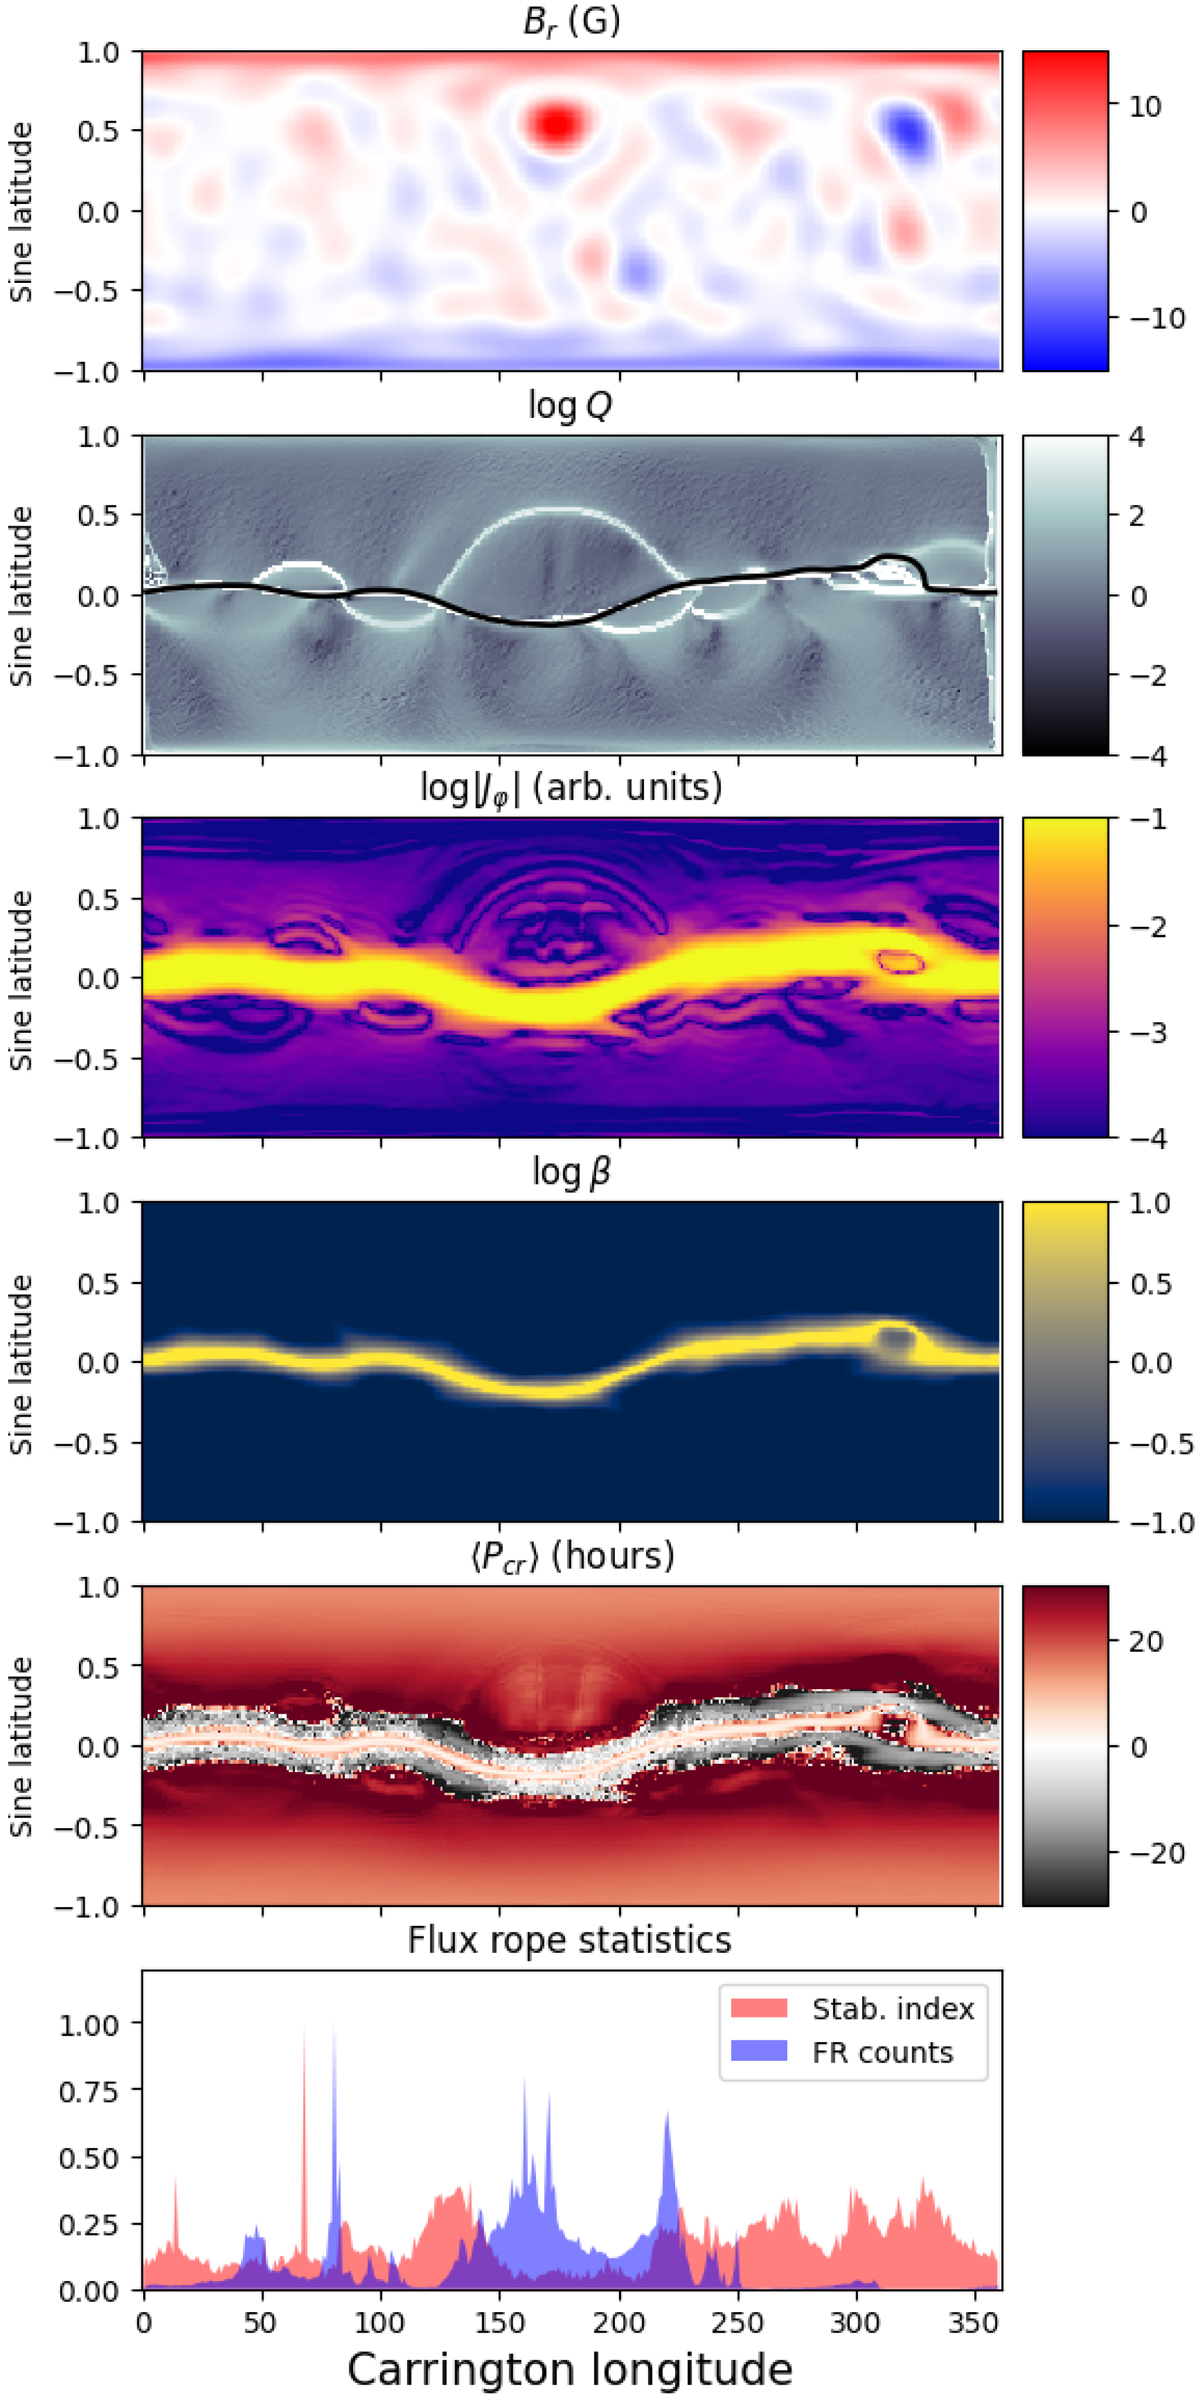
Fig. A.1.
Download original image
Spatial structure of the June 1 simulation. Top panel shows the surface magnetic field obtained from the ADAPT magnetogram. The second panel displays the logarithm of the squashing factor Q. The HCS is shown in black, while secondary arches indicates QSLs. The third panel shows the logarithm of the azimuthal current Jφ at 3 R⊙. Maxima are located at the HCS with some variation of intensity along the sheet. Currents also appear at quasi-separatrices. The fourth panel shows the logarithm of the β parameter at 3 R⊙. Higher β are observed at the HCS and close to the HCS/QSLs intersections. The average ⟨Pcr(r = 3 R⊙)⟩ is shown in the fifth panel, displaying consistently stable regions at the QSL/HCS intersections. Finally, the last panel shows the normalized histogram of detected flux ropes in the simulation in blue and the stability index described in the text.
Current usage metrics show cumulative count of Article Views (full-text article views including HTML views, PDF and ePub downloads, according to the available data) and Abstracts Views on Vision4Press platform.
Data correspond to usage on the plateform after 2015. The current usage metrics is available 48-96 hours after online publication and is updated daily on week days.
Initial download of the metrics may take a while.