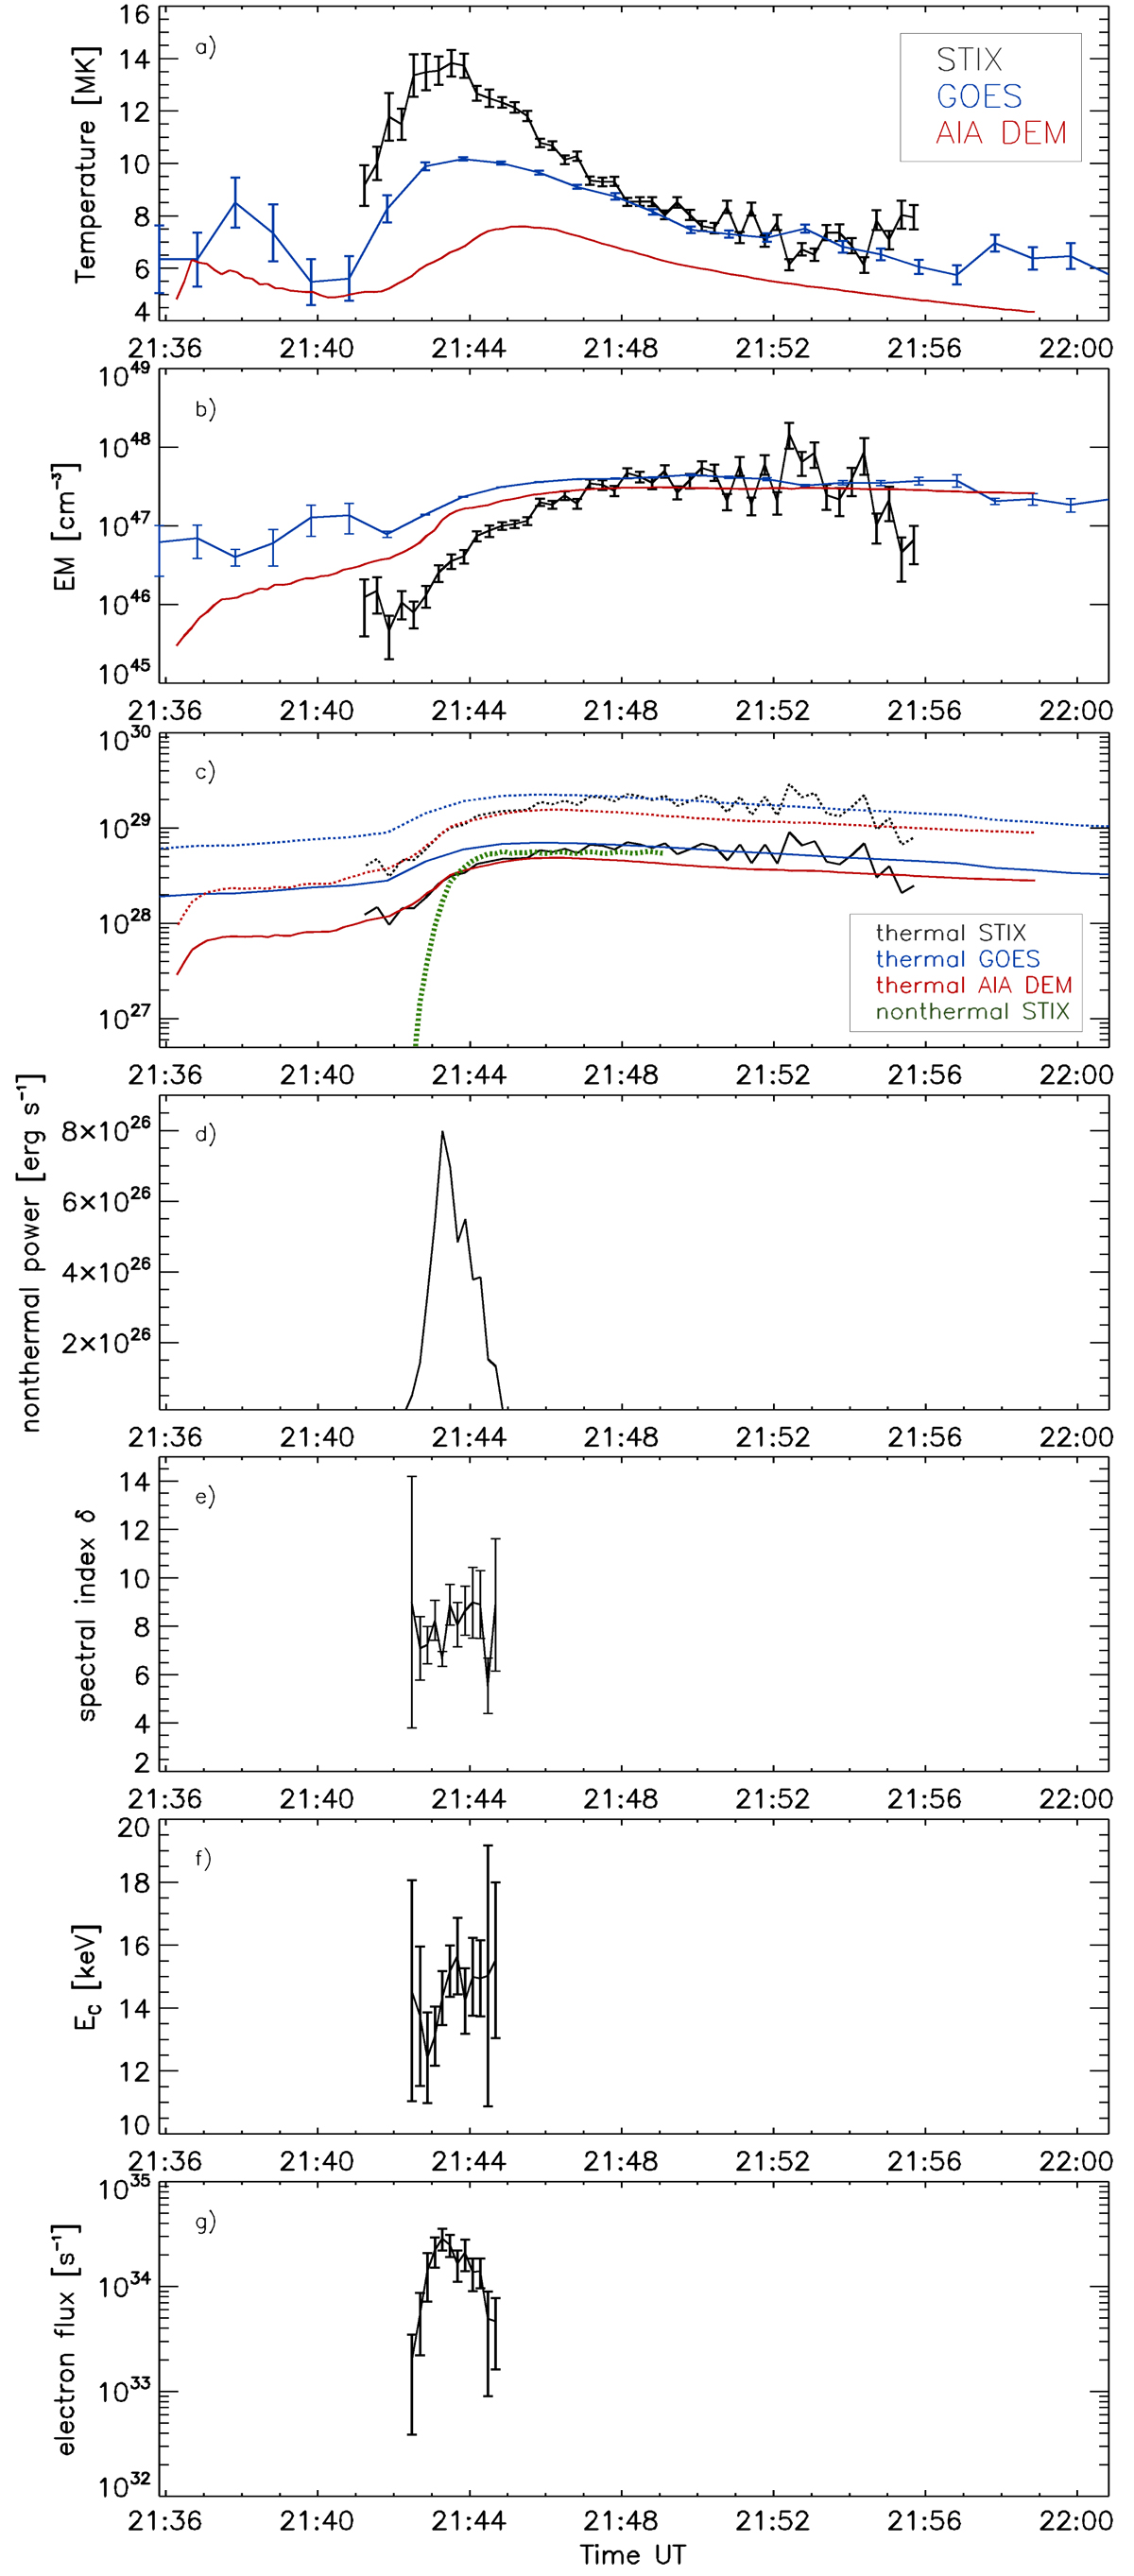
Fig. 7.
Download original image
Time evolution of temperature, EM, and thermal energy of the flaring plasma derived from STIX, GOES, and AIA data for the B6 flare on 7 June 2020 (top panels). For the thermal energies, upper (dashed lines) and lower (solid lines) estimates using different flare volumes are shown. Evolution of the nonthermal energy and parameters from the thick target fit to the STIX spectra during the flare impulsive phase (bottom panels).
Current usage metrics show cumulative count of Article Views (full-text article views including HTML views, PDF and ePub downloads, according to the available data) and Abstracts Views on Vision4Press platform.
Data correspond to usage on the plateform after 2015. The current usage metrics is available 48-96 hours after online publication and is updated daily on week days.
Initial download of the metrics may take a while.