Free Access
Fig. 6.
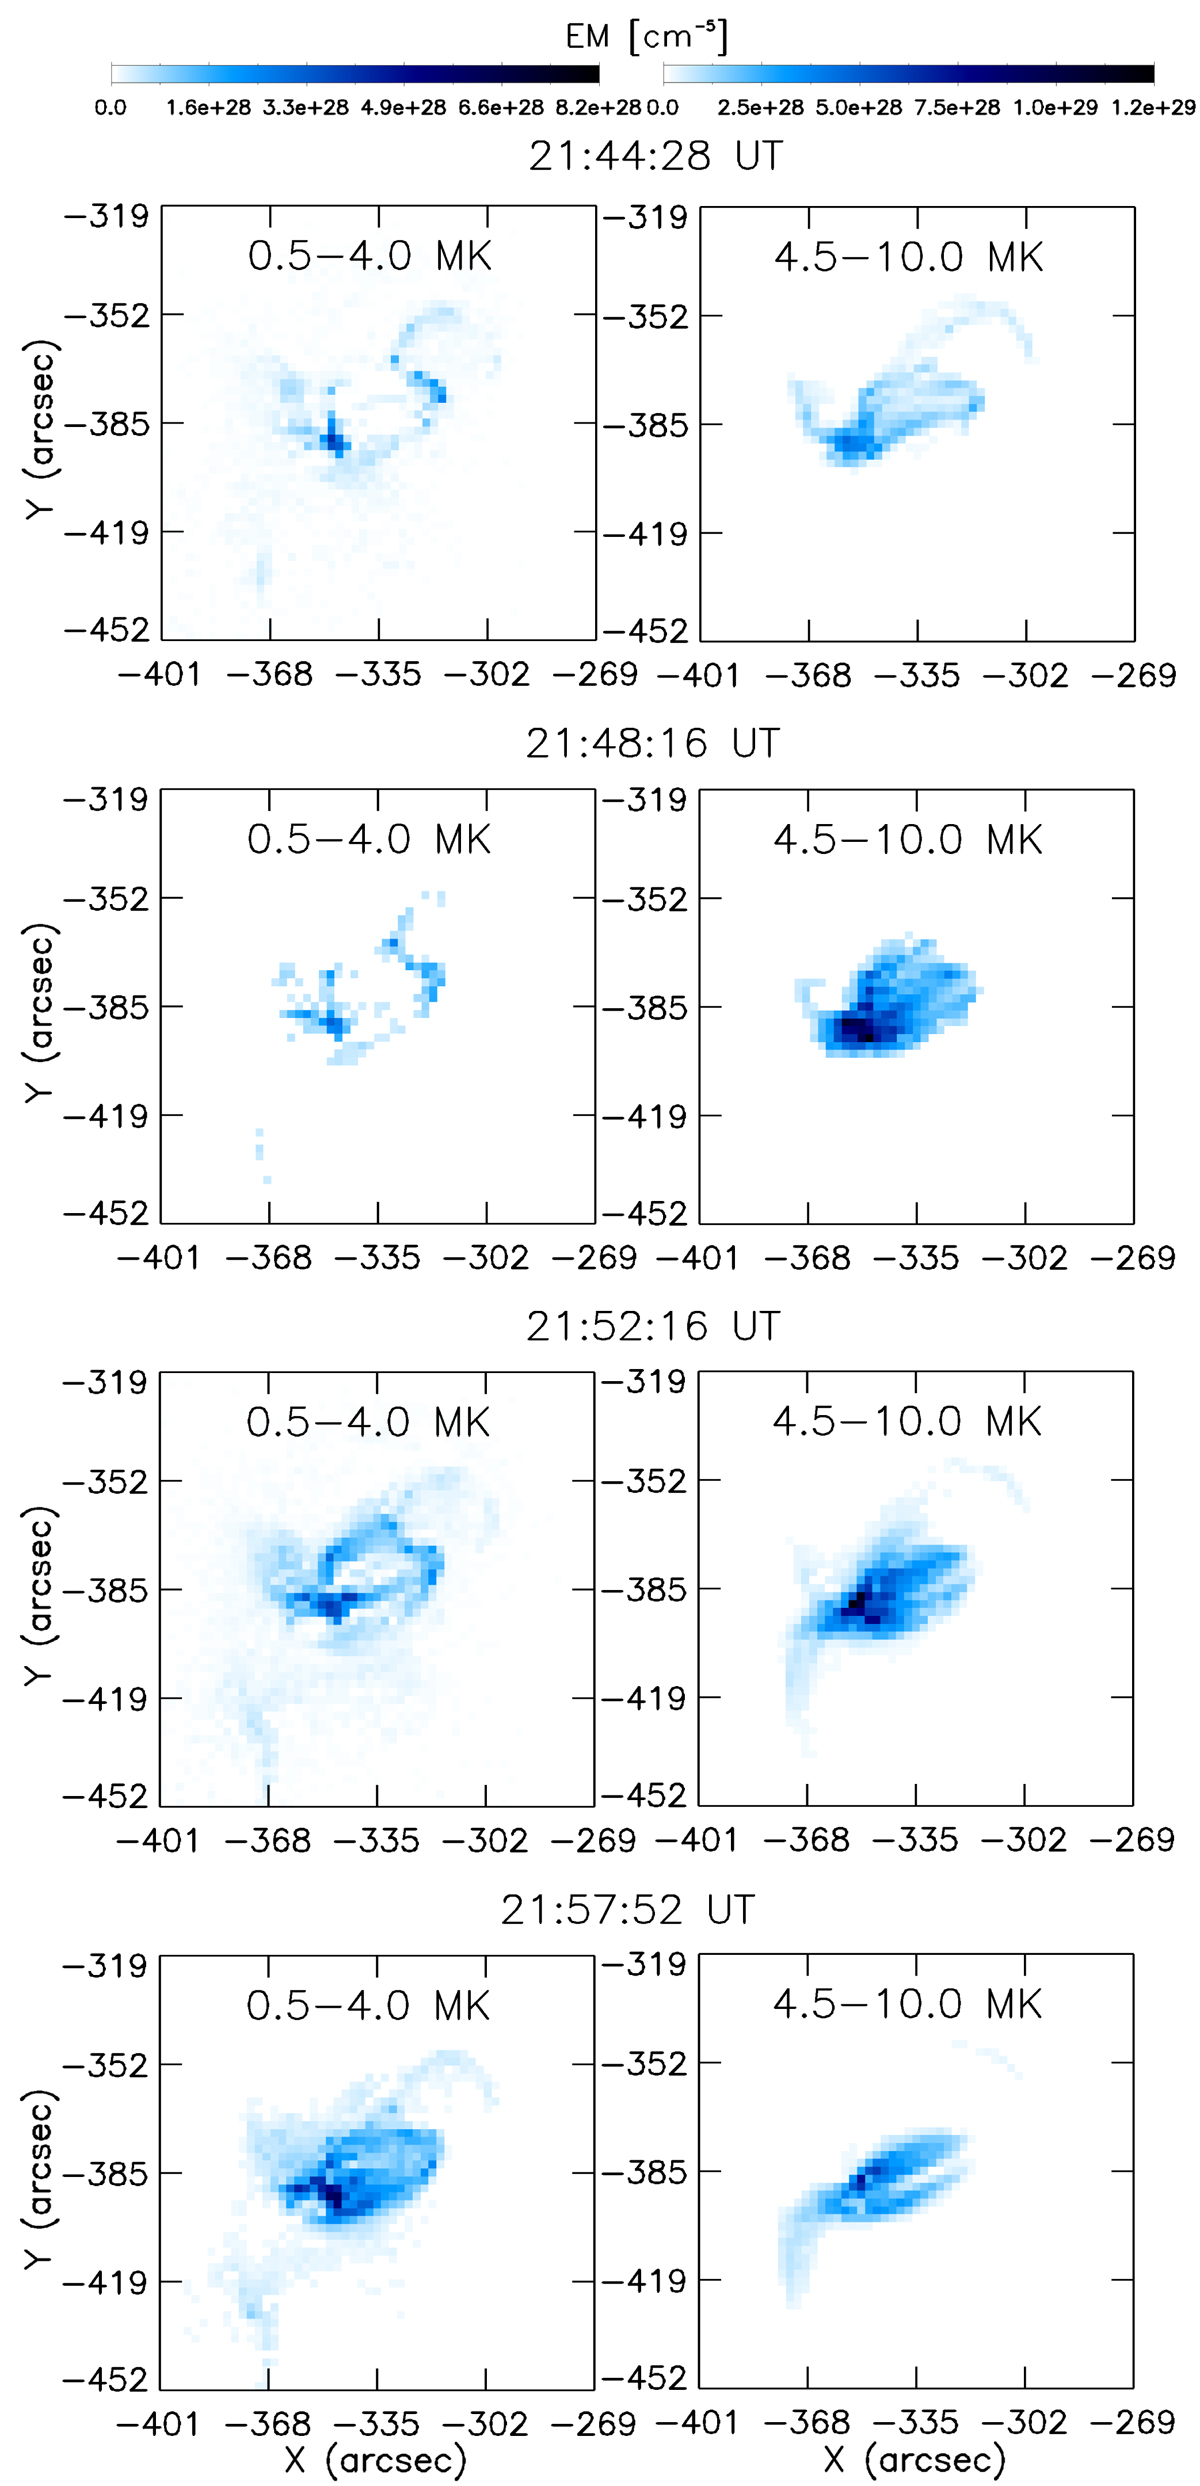
Download original image
EM maps in temperature bins from 0.5 to 4.0 and 4.5 to 10 MK reconstructed from the AIA DEM over the course of the B6 flare on 7 June 2020, highlighting the cooler flare kernels and hotter loops.
Current usage metrics show cumulative count of Article Views (full-text article views including HTML views, PDF and ePub downloads, according to the available data) and Abstracts Views on Vision4Press platform.
Data correspond to usage on the plateform after 2015. The current usage metrics is available 48-96 hours after online publication and is updated daily on week days.
Initial download of the metrics may take a while.